
For the last 5 years Christchurch Transport Operations Centre (CTOC) have been tracking the levels of roadworks in Christchurch. They do this through an online system which contractors use to apply for their “traffic management plans” (TMPs). GIS software is then used to calculate the total length of roads affected by the TMPs, as a percentage of the total length of roads in Christchurch.
This method isn’t perfect as not every TMP ends up being actually implemented in full, and also many are for only short timeframes so they won’t all be simultaneous. However they still give us a reasonable proxy for roadworks.
The graph below shows the percentage of roads potentially affected by TMPs over the last 5 years.

It can be seen very clearly that TMPs (and by inference, roadworks) gradually increased through 2014 and 2015, peaked in early 2016, and then gradually decreased through 2017 and 2018.
CTOC also produced the same graph but just looking at the core public transort routes, rather than all roads.

The shape of the graph is roughly the same, but the percentages are far higher – throughout much of 2016 in excess of 80% of the core public transport network was potentially compromised by roadworks. I haven’t looked into the reasons for this, but I suspect it is to do with the city’s key underground infrastructure coinciding with the historic tram routes, which have evolved into the core public transport routes.
And here’s the same thing but for the strategic road network and the strategic freight network respectively.


Again, they have broadly similar shapes, with the exception that the freight network takes a late rise in 2018 due to a number of motorway/expressway projects that are unrelated to the earthquake rebuild – work on the western corridor, Lyttelton tunnel, northern and southern motorways, and western Belfast bypass all make appearances.
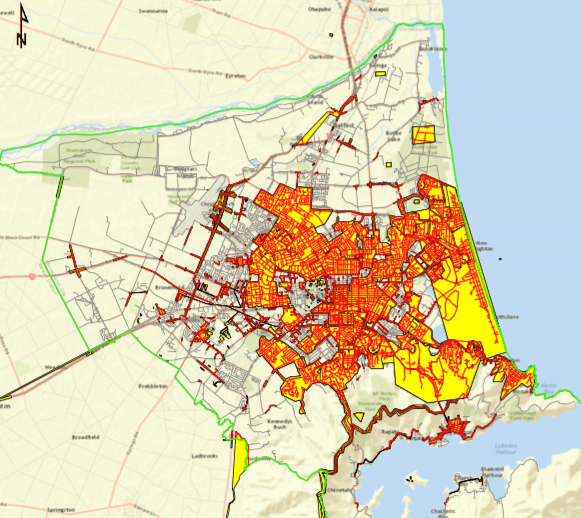
To give you a picture of what the TMP maps look like, here is the most recent one for November 2018 (yellow=TMPs, red= affected roads, grey = unaffected roads):

The northern, southern and western motorway/expressways are all visible.
And here’s what peak roadworks looked like in March 2016:
To me, these maps paint a pretty crazy picture. I think it helps contextualise the sheer quantity of work that was required during the rebuild, and also shows when the work peaked and how it has been gradually decreasing for several years now.
So next time you get frustrated with roadworks, keep in mind that it is a lot better than it was a couple of years ago, and should only get better from here.
