In 2015 Christchurch City Council made the decision to build a citywide network of cycleways, in response to numerous public requests through the post-earthquake “share an idea” conversations.
A business case was prepared making the case for investment. This is available online but devishly difficult to find. A fairly detailed summary is attached to the supplementary agenda of the infrastructure, transport and environment committee’s 5th March 2015 meeting here.
This blog post is an attempt to check what was predicted in that business case, and compare it to what we are seeing on the ground.
The business case assumed that the network of cycleways below would be constructed over 6 years from 2015 to 2021.

At the time the cost was estimated at around $160 million.
The business case modelled the number of daily bike trips made in the city under different future scenarios. The graph below shows that in 2006 (green bars), around people were making around 50,000 bike trips a day around Christchurch. The four bars at the left show the expected number of trips if we do not build a cycleways network. You can see they increase due to population growth, to the order of around 15% increase by 2021.

If you then skip across to the far right group of bars, this shows how the number of trips was expected to grow if we build all the cycleways, making a number of assumptions on things like petrol and diesel prices continuing to rise, and people who currently drive cars being relatively open to switching to riding a bike. This scenario predicts a 50% increase in trips by 2021 (from 2006). If you pro-rata this to a base year of 2017 (it will become obvious why later), then it’s about a 35% increase in trips.
The two blocks of bars in the middle are both sensitivity tests showing what happens if (a) fuel prices don’t rise as much and (b) people are less willing to change their behaviour than expected. These scenarios show 30-45% increases by 2021 from 2006, or roughly 17-31% increase from 2017.
This map shows where the highest volumes of cyclists was modelled.

They then calculated the benefits according to the standard economics procedures that every transport project is required to complete. If the expected growth in cyclists was realised, then the benefits to society were calculated to be $8 per $1 spent, or a benefit-cost-ratio of 8. Most of the benefits relate to health and environment.


The base case is the top line with a BCR of 8. The two more pessimistic scenarios are shown in the lines labelled Sc1-2 and SC1-4, which have benefit-cost-ratios of 6 and 3 respectively.
So how are things tracking in reality? Well a few things have changed.
Firstly, they’ve taken longer to build than planned. We’re now two years past the point they were supposed to be completed, and we’re only around two thirds complete, shown below. Personally I think is still a pretty good achievement, it’s certainly better than most other cities are managing.

The latest one to open is the coastal pathway, with jono DW posting this video of it online.
Secondly, we had covid hit, which completely changed everyone’s travel patterns for 3 years and is only just getting back to close to normal again now.
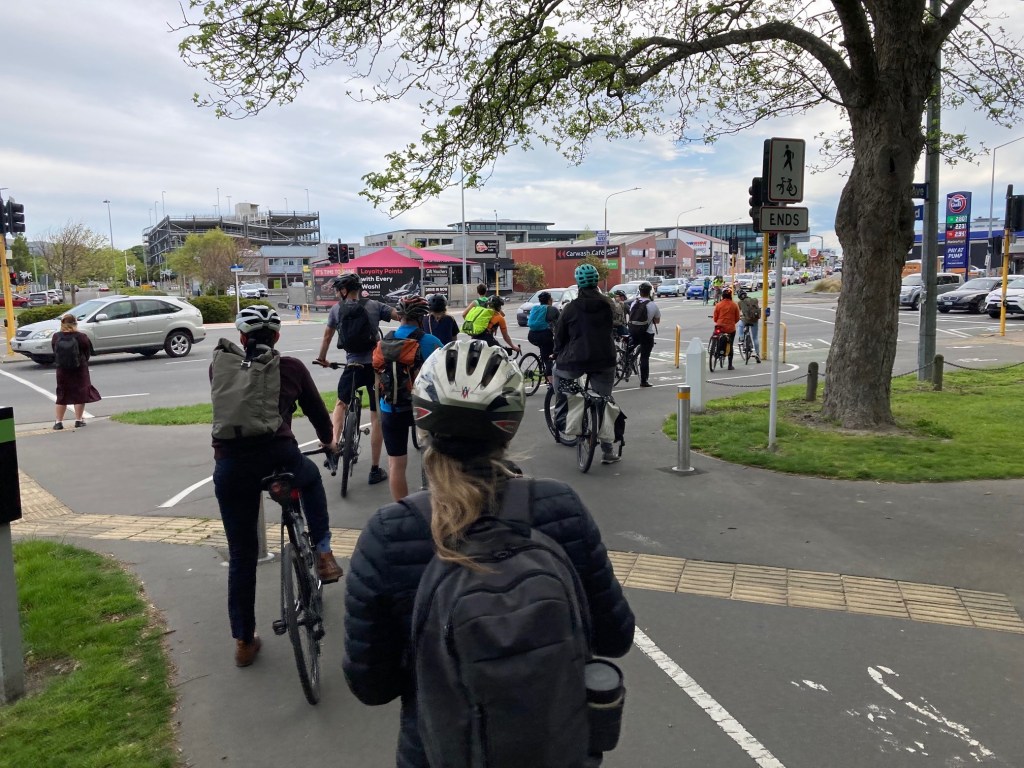
Personally I use the cycleways just about everyday and I know they make my life a whole lot easier. It nice being able to relax and enjoy the ride, instead of constantly stressing that someone’s about to crash their car into me. I’m not alone in this. I snapped this shot on the way home the other day: long queues of cyclists are not an uncommon sight nowadays, whereas I don’t remember noticing this a few years ago.
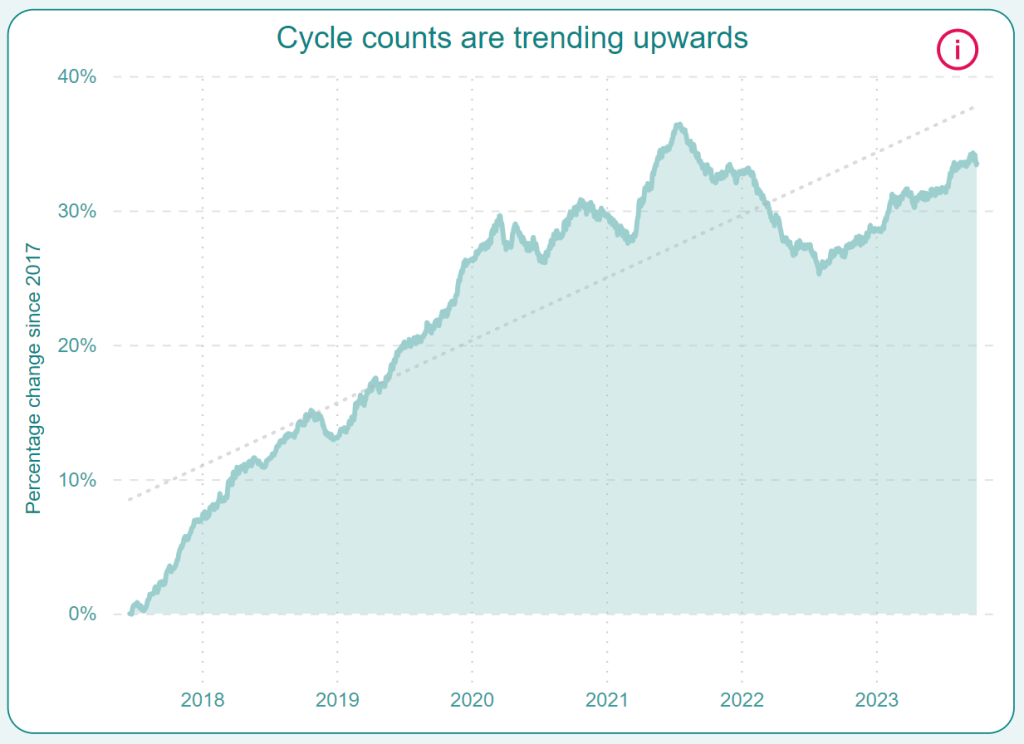
It’s backed up by the data too. Council has been installing a network of automated cycle counters over the last 8 years. Data from these is published online, raw data here and a summary dashboard here. The dashboard shows about 33% growth since 2017. The shape of it suggests it would have been higher if covid hadn’t hit: we were seeing annual growth of about 12% until the start of 2020, then for the three year period 2020-2022 it didn’t grow at all; so far this year we’re on track for double-digit growth again.
Having said that, the data isn’t perfect. It doesn’t record every cycle trip throughout the city; just those passing through at 28 discrete locations. These locations tend to be the busier cycle routes, so it’s not necessarily representative of the whole city.
Census is another good source of data. In 2018 they introduced a new question for the first time, asking how people usually get to work and/or education. The 2023 census repeated this so it will be interesting to see how the responses to that question have changed (census results will be out early-mid next year). Even that though is incomplete because it doesn’t record the trips which are not work or education related, which we know is a significant proportion.
The graph below shows petrol and diesel consumption in Christchuch, also published online here. It shows consumption peaking in 2017 and dropping steadily over the next 6 years, despite the population growing in that time. There are a range of factors that influence fuel consumption, but I don’t think it’s a complete coincidence that as the number of people cycling in Christchurch has grown, the amount of petrol and diesel getting burnt has shrunk.

So the business case calculated a whole host of benefits based on modelling that suggested we should expect about 35% growth in cycling from 2017 to 2021, assuming the entire cycleways network would be completed by then.
Sensors suggest that we’ve had growth of about 33%, despite only building about two thirds of the network.
Based on this, it seems that the business case writers did a pretty awesome job; either that or they just got lucky. The growth forecast is pretty much bang on what we’ve observed, despite a huge amount of stuff happening that they could never have predicted – slower than expected construction, covid, fuel price increases caused by Ukrain conflict, subsequent fuel price decrease caused by fuel excise holidays, the explosion of e-bikes and e-scooters… the list could go on.
The costs of the cycleways programme have been higher than the original estimate, somewhere in the realm of double i.e. ~$320million compared to $160million. If the benefits remained the same then this would half the expected benefit-cost-ratio to 4. But in fact the benefits would have also increased over the last 8 years: values of time have increased, the cost of carbon has gone up, statistical value of life has increased, estimates of the health benefits of cycling have gone up. If the benefit-cost-ratio was recalculated today using both updated costs and updated benefits, my gut feel is that they would increase in roughly equal proportions such that the overall BCR wouldn’t change too much.
The cycleways programme has been subject to plenty of scrutiny and I know they’re not everyone’s cup of tea. But personally I don’t think you can argue with the results: they were initially predicted to produce $8 of benefits to society for every $1 spent, based on them enabling around 35% more people to choose to cycle by 2021. A lot of people at the time were sceptical that estimate was realistic but they’ve been proved wrong: we’re currently sitting around 33% despite only building two thirds of the network. And we’re starting to observe benefits – for example we’re seeing reduced petrol and diesel consumption in the city.
Here’s hoping we manage to knock off the last third sooner rather than later.

Great analysis, Chris. I’m not sure many businesses cases would still look this good after a doubling in cost!
LikeLike