Stats NZ released a big bunch of the detailed results form the 2023 census a few weeks ago.
They’ve released it all via a new tool, the Aotearoa Data Explorer. Sounds great but for me it was impossible to use. They’ve built it so that instead of spitting out excel files as they’ve done for every other census in my lifetime, it now spits out absolutely enormous csv files that are way too big to use in excel. Possibly it’s better for the data scientists our there but it’s now inaccessible to old fashioned excellers like me.
Luckily Christchurch City Council has done a bit of work on them and republished the data in the old-school excel format here (for the whole country). Kapai!
Infometrics have also built a data viewer which is really awesome – no technical nous required whatsoever. I’ve used this viewer to examine some of the data and try and glean insights for Christchurch. I have too many highlights to share in one post, so I thought I’d split it into three posts:
- Population growth
- Travel to work
- Travel to education
So first up: growth! Christchurch has grown faster than the rest of the country. The part inside the Christchurch City Council jurisdiction has grown at a similar rate to the national average of 6% growth since the 2018 census, but neighbouring Selwyn and Waimakariri districts have exploded at 29% and 11% growth respectively. Together the three Greater Christchurch districts have grown by 10%, or about 50,000 people. Significantly Greater Christchurch now exceeds half a million people for the first time in our history.
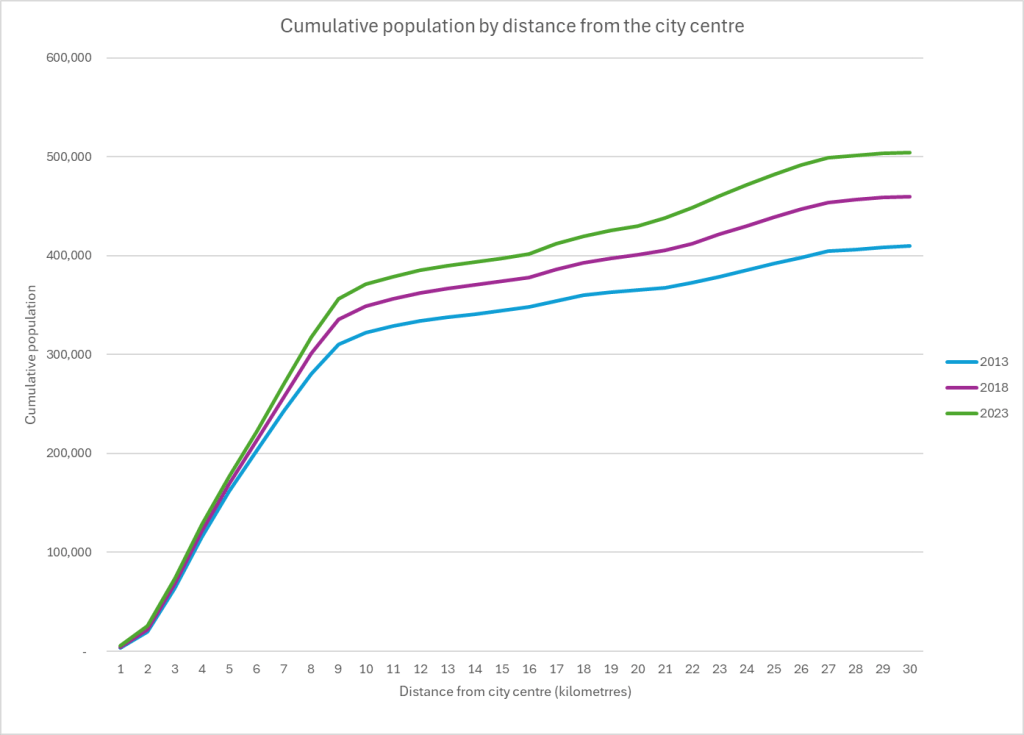
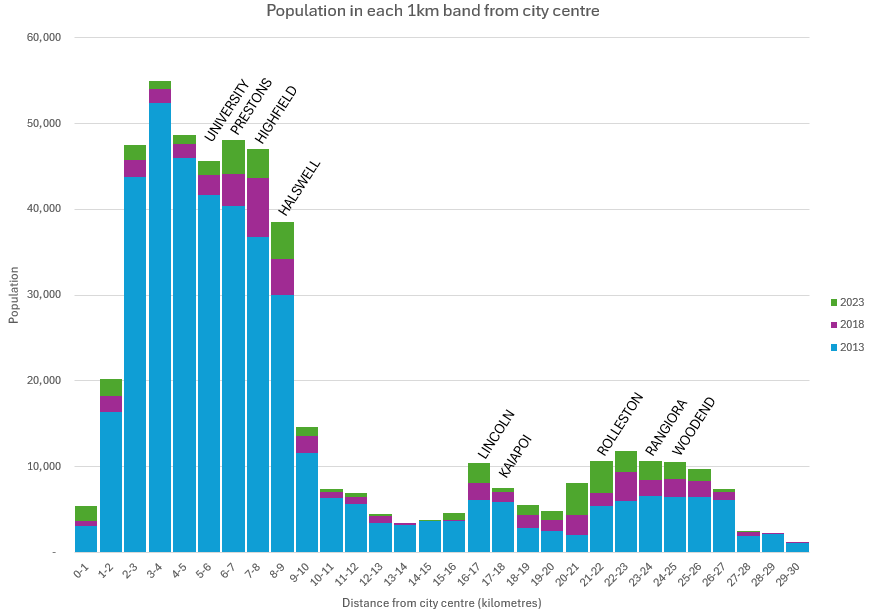
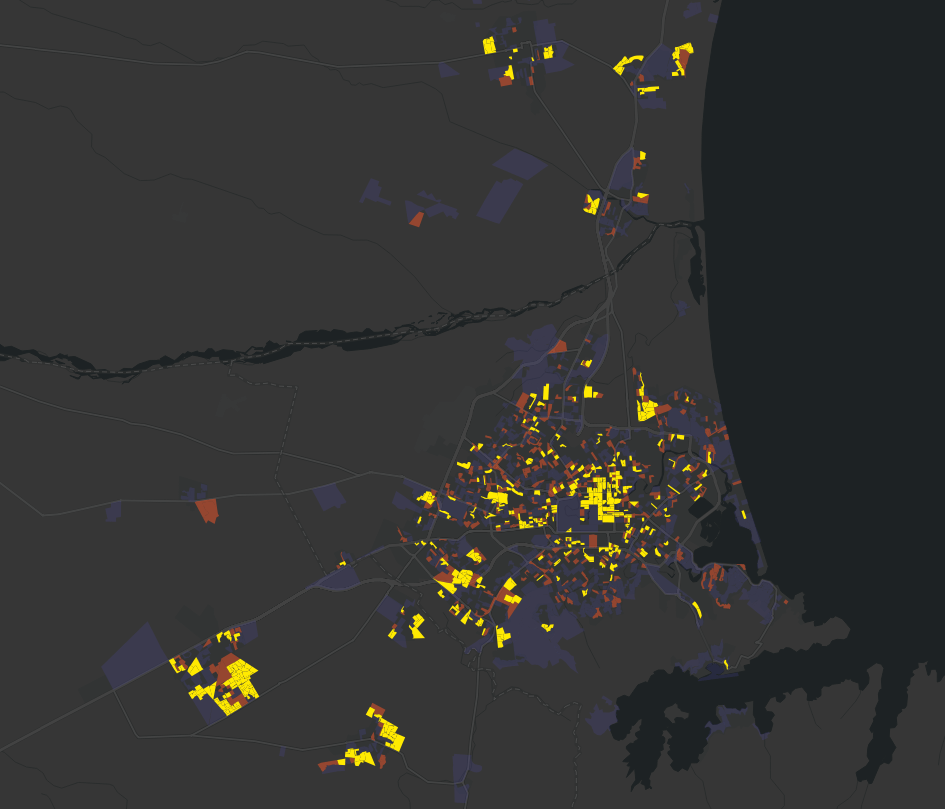
Despite the percentages above, if you look at absolute numbers, then the bulk of the growth is occurring within Christchurch City. It’s reasonably distributed across the central city, inner suburbs, university precinct, and fringe suburbs. Then there’s a band of about 10km of nothing, before hitting growth again in the satellite towns further out: Lincoln, Rolleston, Rangiora and Woodend.

In Christchurch City, a big chunk of the new growth is in townhouses and apartments. The number of people living in “joined dwellings” jumped from 19% in 2018 to 26% in 2023. This shift in housing typology is a trend seen across all the big cities in the motu.

In the central city and inner suburbs, the number of people living in “Joined Dwellings” are now the majority – I wonder if this may be a tipping point and lead to political shifts in those areas.

We are increasingly multi-cultural. Although 76% of Christchurch residents still call themselves “NZ European”, this is down from 78% last census and 83% the census before that. And it’s lower than most other regions – of the 67 territories in NZ only 18 are lower than us.
11% of us call ourselves Maori, which is comparitively low. 4% of us call ourselves pacifica, which again is comparitively low. 17% of us call ourselves Asian which is comparitively high. All three of those figures have grown substantially since the last census. Middle Eastern, Latin American, African and Other round out the last 3% of us.
(note it doesn’t add to 100% as people are allowed to put multiple ethnicities)
So that’s growh. Anything stand out to you?
Next up I’ll take a look at the travel to work responses.

Thanks a lot for that. I’ve been tearing the little hair that I’ve left out trying to make Aotearoa Data Explorer work. I couldn’t even find the 2023 travel to work data. Other datasets were either very large or totally empty…
LikeLiked by 1 person