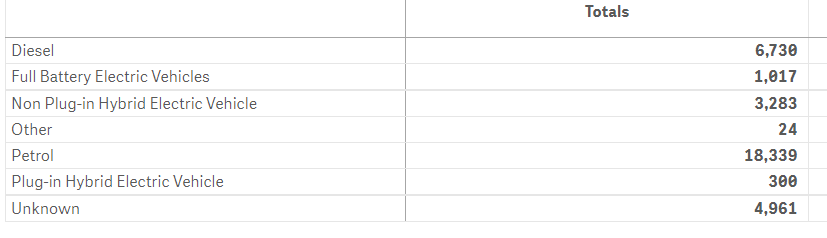
Waka Kotahi have just released a new dashboard reporting all new motor vehicle registrations. Last year these were the numbers nationally.

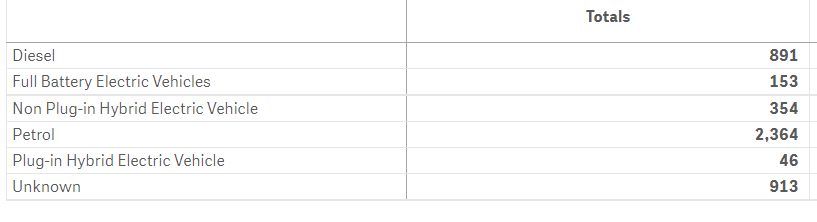
In Christchurch City:
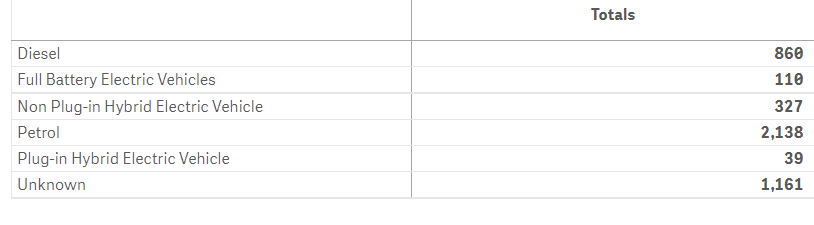
In Selwyn District:
And Waimakariri District:
Percentages are these:
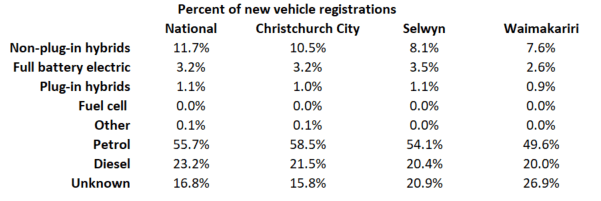
I was a little surprised at these numbers. I had thought that uptake of electric vehicles would be higher in urban areas and lower in rural areas due to their lower ranges, so I thought NZ’s second-largest city would be higher than the national average. But if you look at the top 4 rows, the three Greater Christchurch Districts tend to have lower percentages than the national average.
For the same reason I had also thought Christchurch City would be higher than Selwyn and Waimakariri. This is true for non-plug-in hybrids, but not for full battery and plug-in hybrids.
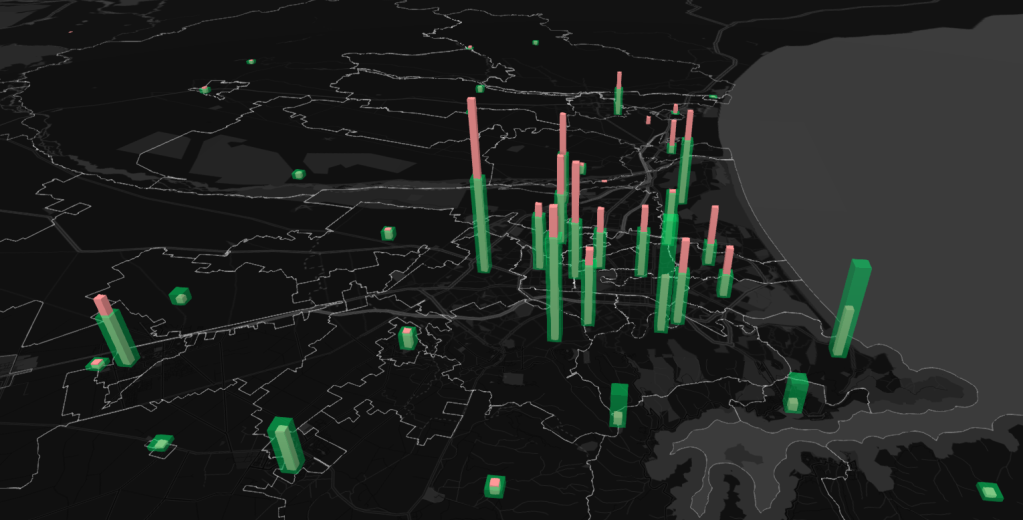
The data is quite granular and you can break it down by smaller areas. The map below shows the total new vehicle registrations in red, and the full battery electric uptake in green (at different scales), by suburb. Areas where the green is taller than the red indicate high uptake of electric vehicles. Areas where red is taller than green indicate low uptake of electric vehicles.

Areas with a high proportion of people buying electric vehicles are Sumner, Lyttleton, Governor’s Bay, Cashmere and Lincoln.
Areas with low proportion of people buying electric vehicles are Yaldhurst, Central City, New Brighton, Belfast, and Kaiapoi.
Again I was surprised by this. I expected to see rural areas buying petrol cars and inner city areas buying electric cars, due to the shorter distances of travel. I also thought I might see richer areas buying electric cars and poorer areas buying petrol cars. There is arguably some element of that (e.g. Sumner), but it’s not really particularly obvious (e.g. Fendalton, Ilam and Central City are all richer but very petrol heavy). There almost seems to be a pattern of people living on the hills going electric in greater proportion than people who live on the flat. Something to do with topography maybe? Or perhaps hill-dwellers tending to be more in touch with nature and the need to look after our environment than flat-dwellers?
I don’t know what to conclude from this, but it’s a cool data source anyway. Will be worth checking back on once electric car sales start to ramp up (they’re still tiny at the moment so need to be careful drawing any firm conclusions).
And a reminder that this is just larger electric vehicles: e-bikes and e-scooters are not included in these numbers. Their sales completely dwarf electric car sales and will soon overtake all cars in terms of sales – this micro-mobility is where the real e-vehicle revolution is happening.
