I finally found out why Christchurch is so car-centric. And no it’s not that we have an inexplicable love of cars that is different to every other city in the world. It’s not just that we have always been a “car-city”. It’s not our topography, weather, economy or location.
Christchurch is car-centric because in 1965 a small group of transport planners made a conscious decision to build it that way.
My work colleague was clearing out her desk the other day and asked me if I wanted this old book that she was about to dump in the rubbish bin.
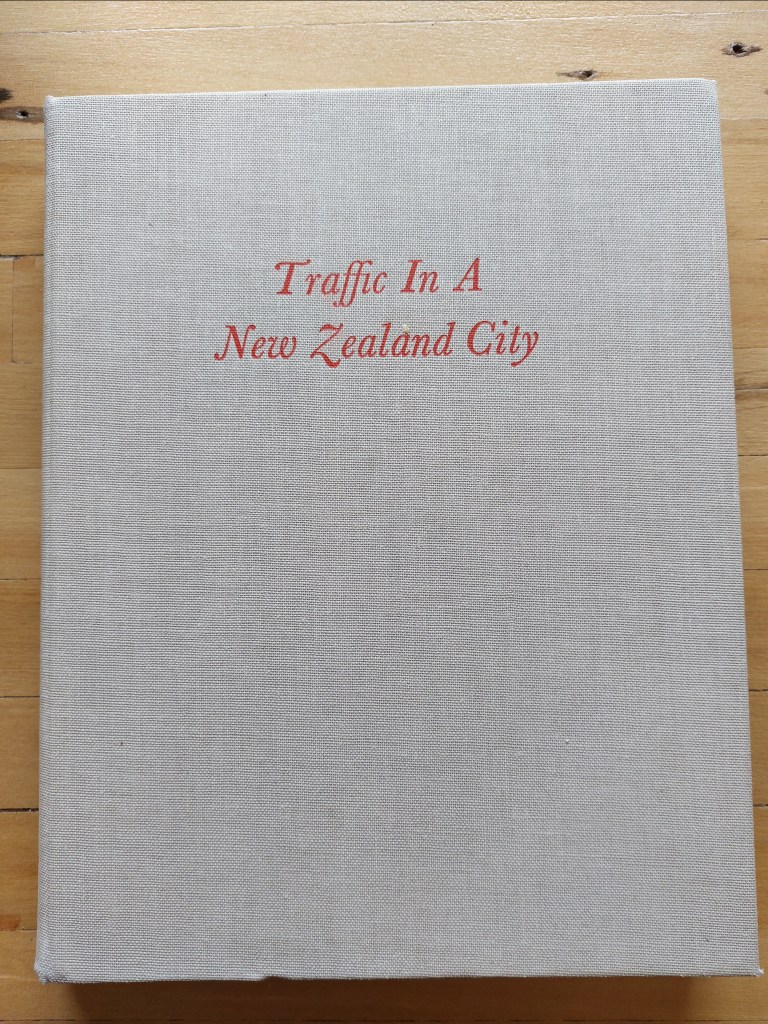
It was edited in 1965 by W.B. Johnston, a reader in geography at the university, who was commissioned by the Christchurch Regional Planning Authority.

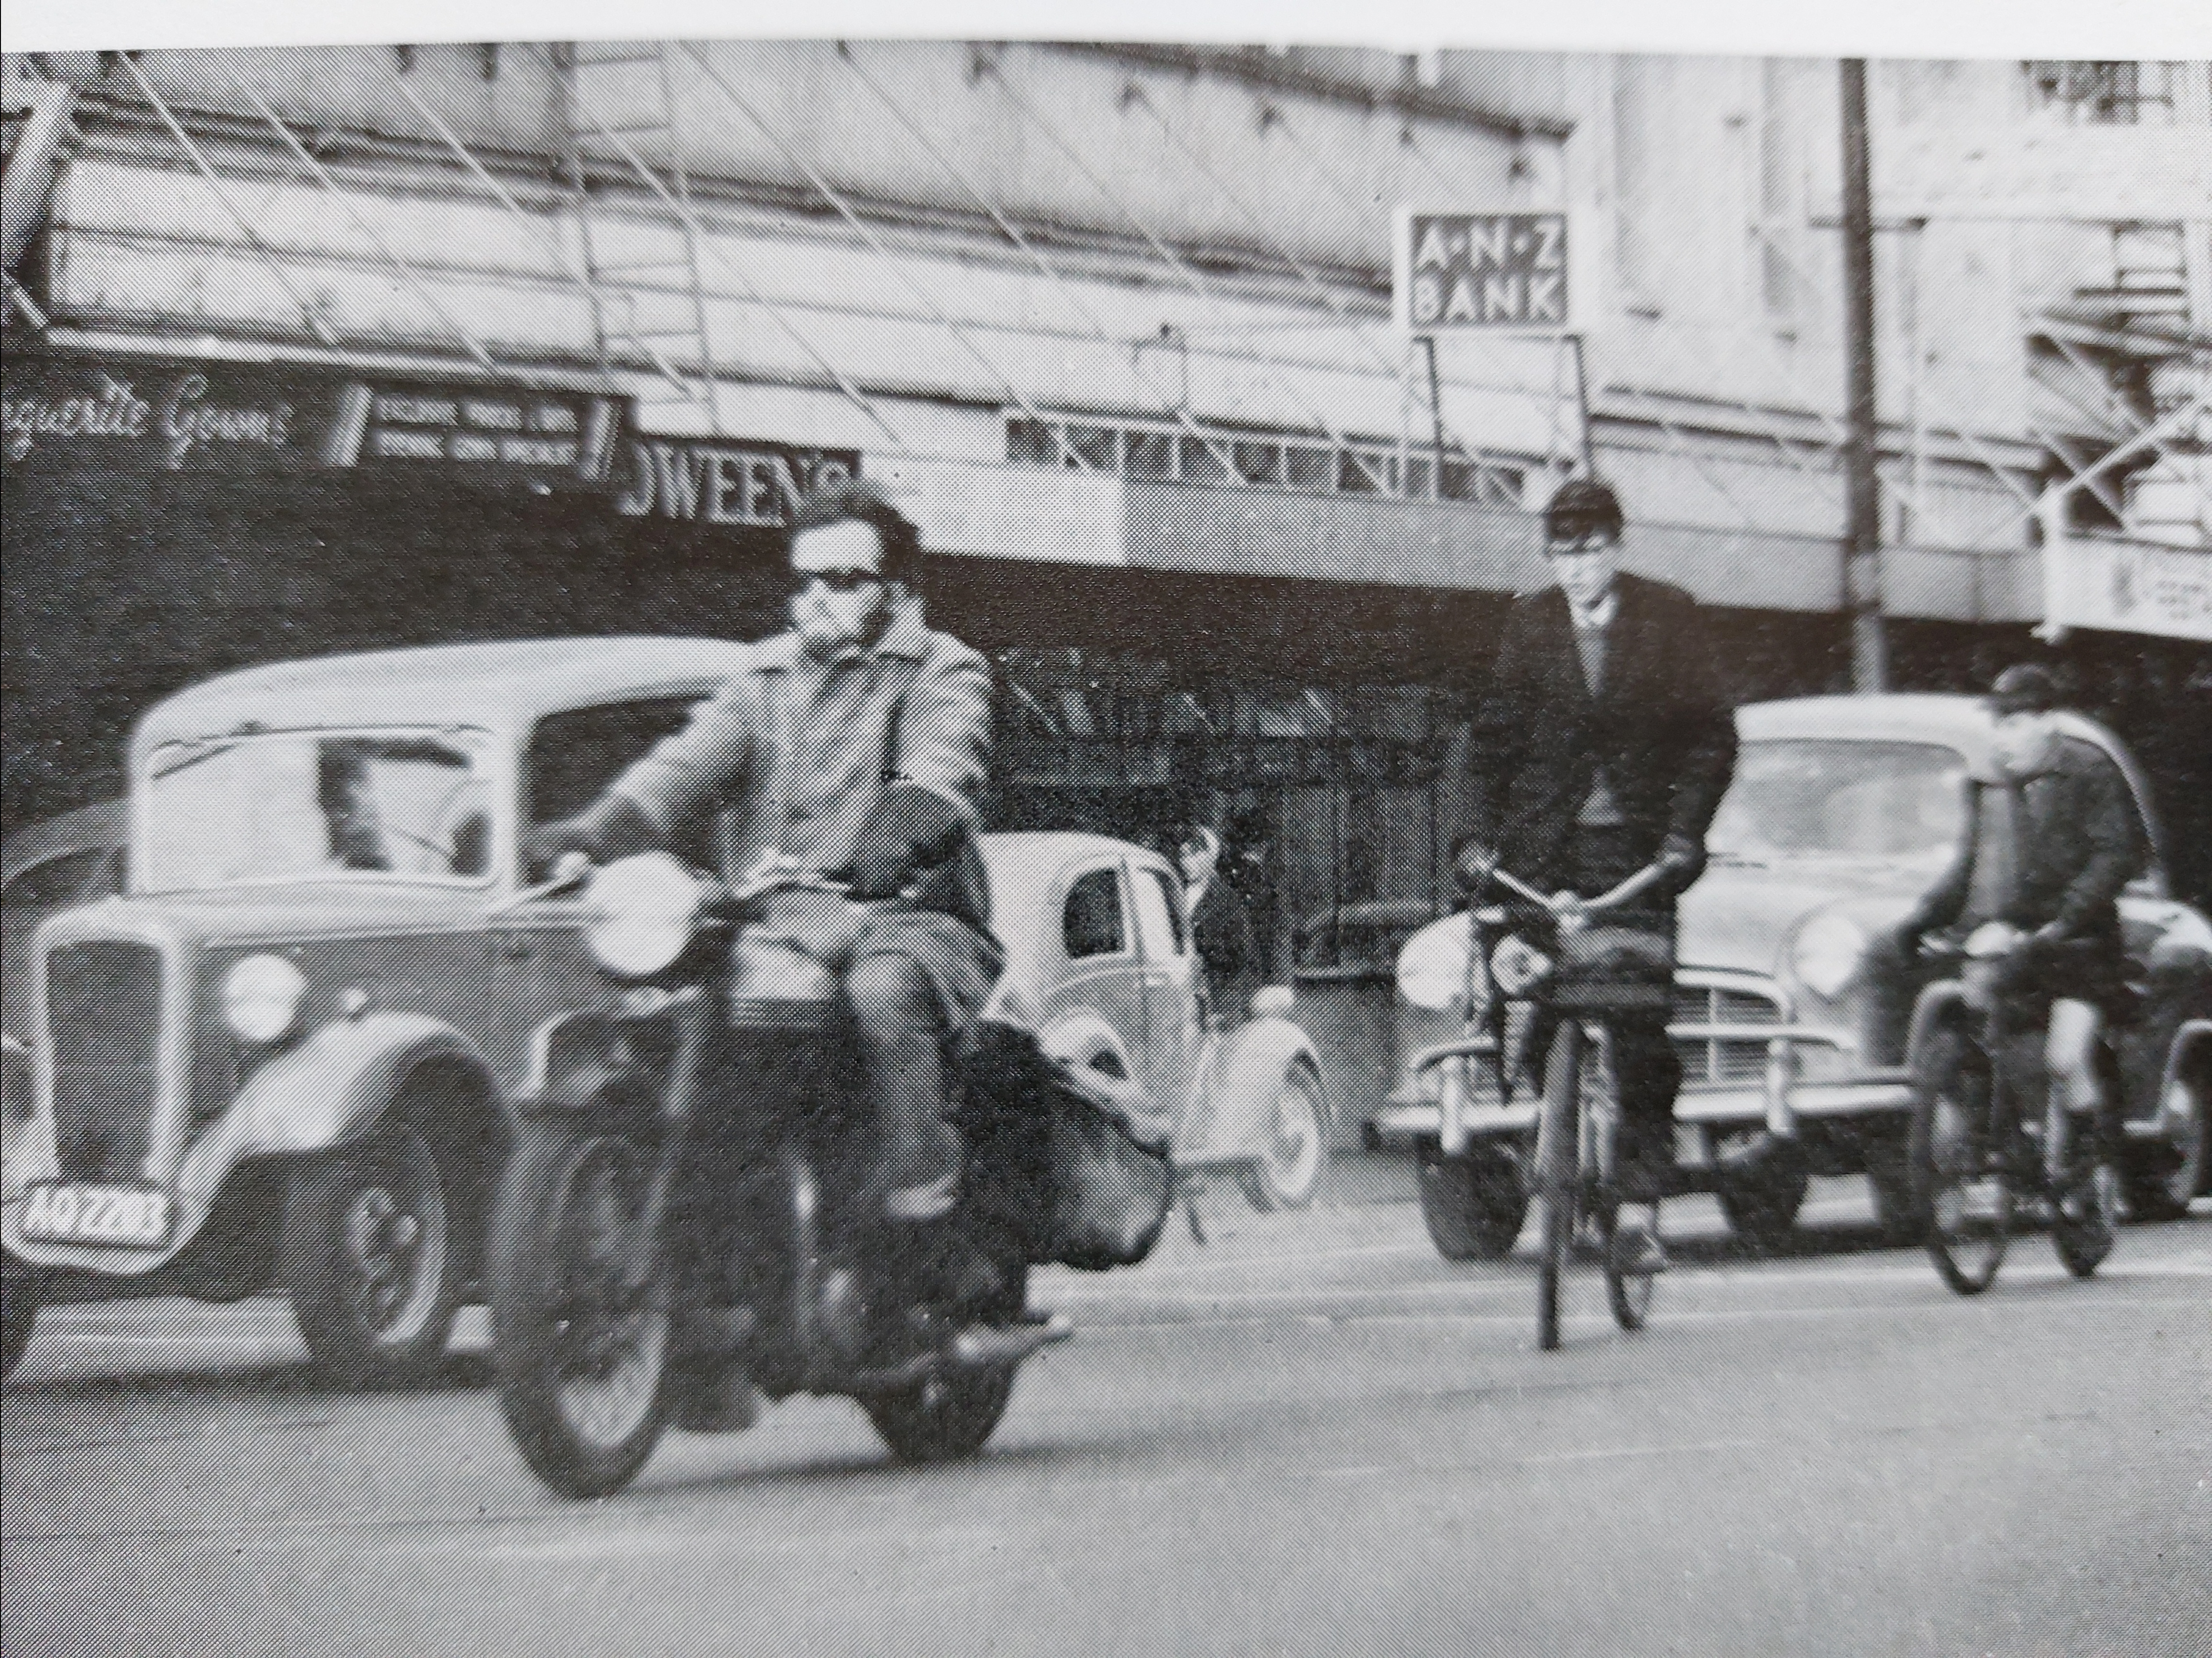
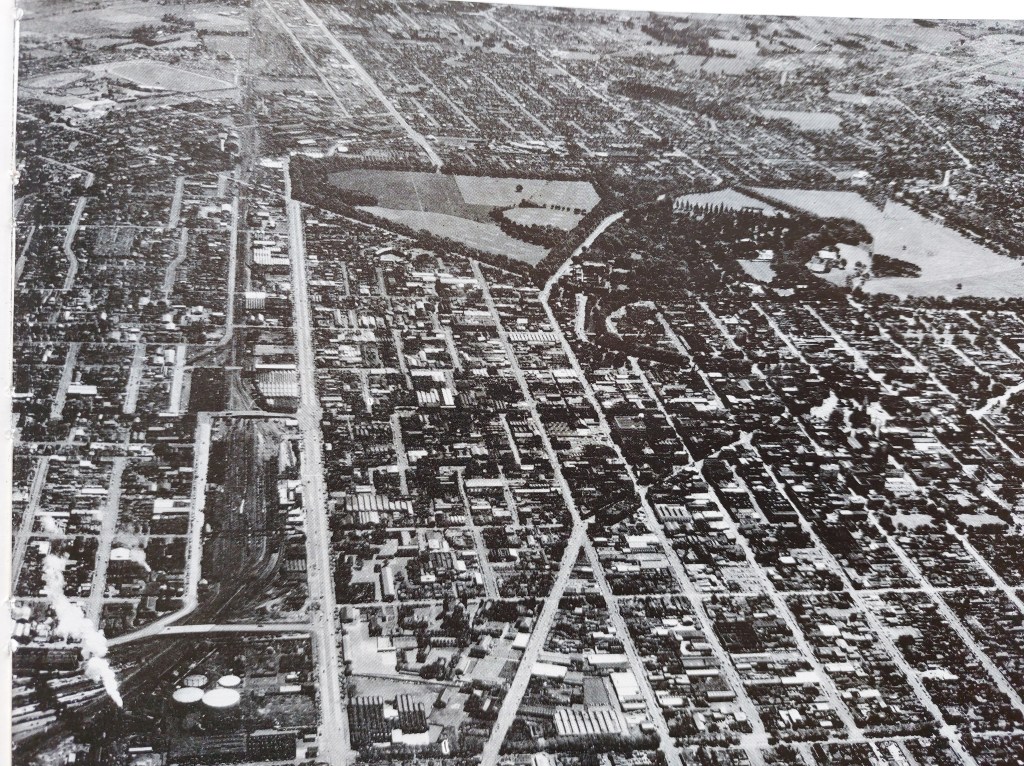
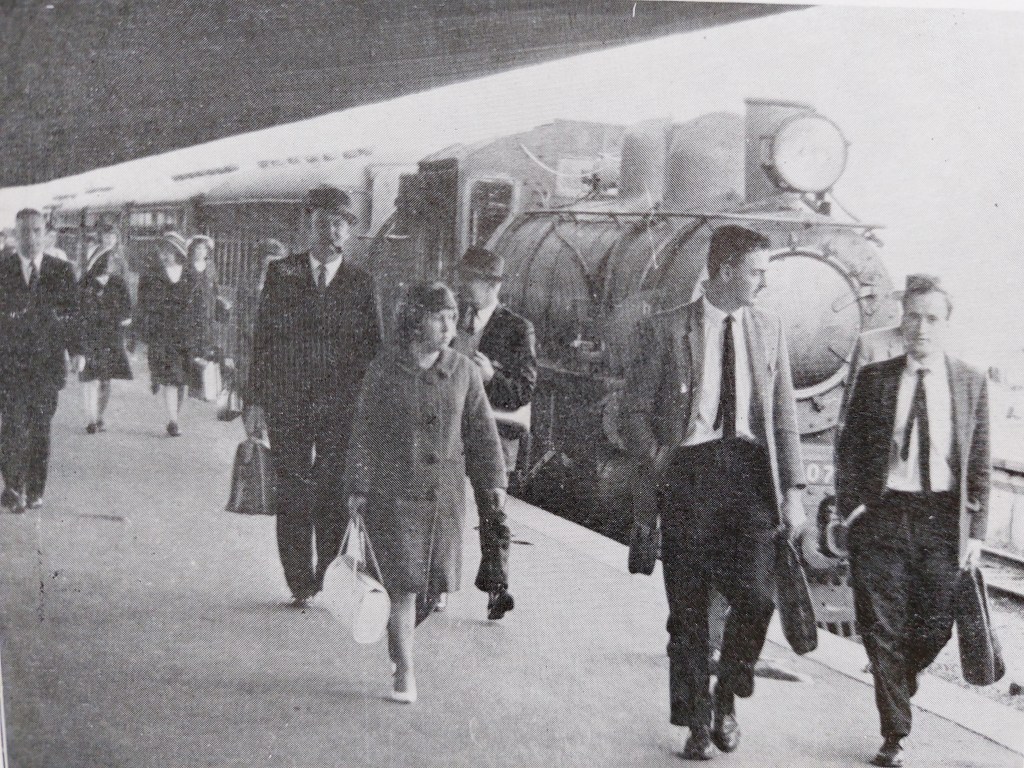
It’s full of great old photos.

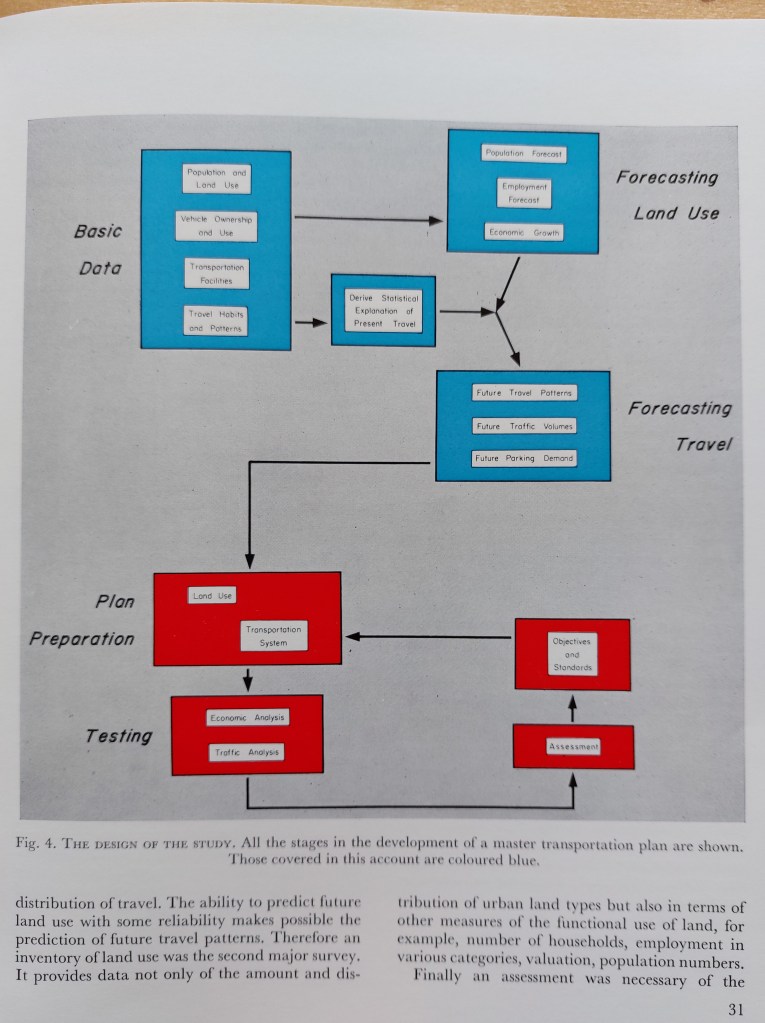
Its not obvious at first, but the book is the first half of the 1965 Christchurch Master Transport Strategy, laying out how the city’s transport network should develop over the next two decades. It first outlines the problem. This is basically trying to cater for population growth, in conjunction with the growing popularity of the motor vehicle.

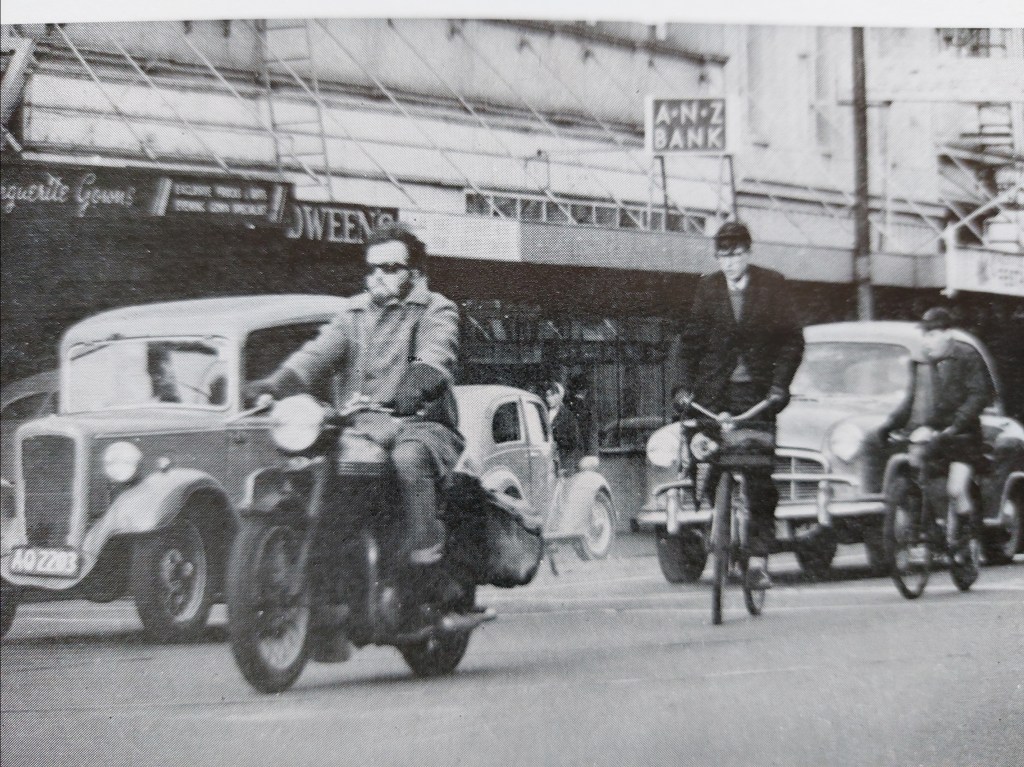
Some more information on mode share, stressing the unusually large numbers of cyclists.
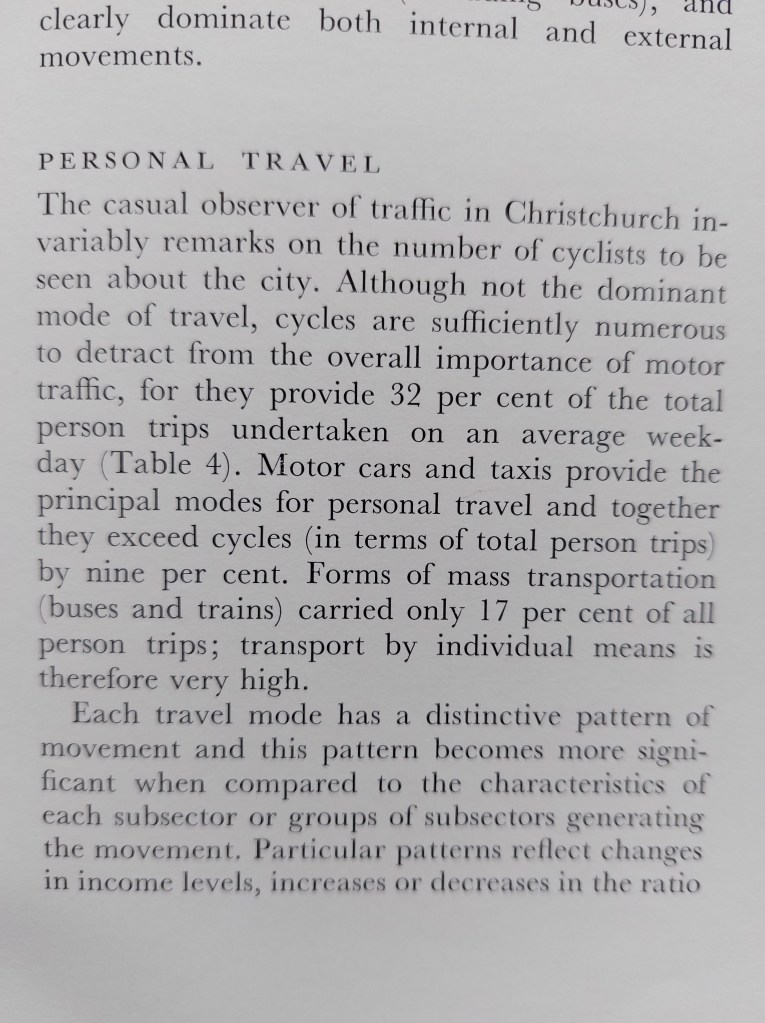
They then predicted that, as “material standards of living” increased, more families would go out and buy cars.
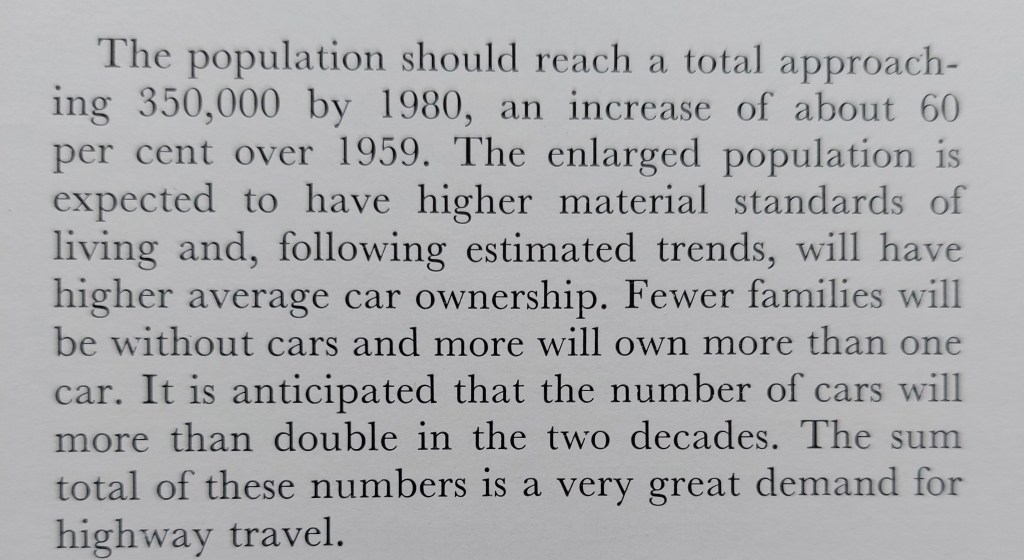
There is then a bunch of technical analysis and traffic modelling. They use a lot of complicated mathematical formulae to calculate that car traffic will roughly double by 1980, due mainly to their prediction that everyone will rush out and buy more cars as they get richer. They don’t take infrastructure into account, they just assume that people will choose to drive more, irrespective of whether it’s physically possible or not.
Their calculations conclude that traffic volumes will grow by 142% to 1980.

They then show that this amount of traffic can’t fit down the existing roads, using this amazing piece of graphic design (probably hand-drawn).

They then conclude that council must respond to this unavoidable growth in traffic volumes by ensuring its roads are wide enough to accommodate it all. They never seriously consider the idea that this isn’t a logical necessity, and that they do in fact have the option to just *not* accommodate all these extra cars.
This conclusion sums things up. This piece of writing seems absolutely bonkers to me. Have a read and see if it seems to you like it was written by a fanatical extremist, rather than an objective analyst.

This myopic focus on the car is very strange to me. They seemed to think that their only choice was for the city to accommodate all this extra traffic, at whatever cost. There is no discussion of what these costs might actually be, nor of the possibility that these costs may outweigh the benefits. There is no discussion of alternative options and the possibility that these may be better than the one option they’ve thought of.
Following publication of this Transport Strategy they spent the next two decades doing exactly what they promised – channelling “substantial community resources” into widening our roads, building motorways and carparking buildings, and progressively diverting road space and funding away from public transport and cycling.
To their credit, they were remarkably successful in what they set out to achieve – dramatically increase the amount of traffic on our roads. The irritating thing about Cantabrians is that, when they decide they want to be top of the world at something, they have a tendency to get there. Which is why it’s even more important for them to make sure they’ve picked the right target to be aiming for.
It’s a real shame that they thought copious traffic lanes and parking buildings was that target. How different would Christchurch look today if they’d been open-minded enough to consider alternatives approaches, and if they’d ended up going down a more balanced path that included walking, cycling and public transport? We would have a completely different city.
I’ll finish with a bunch of awesome photos from the report.


There’re a couple of current CCC councillors who have obviously made it their mission to implement this policy from 1965 even today. And even argue that it will be good for the environment… somehow.
See this video of the council debate on the NZUP programme for Brougham Street.
Saw this on the Brougham Street for the People Facebook group.
LikeLike
The thinking has lingered for a surprising long time. I think its changing though -council is at a point where the majority now realise our mode share is a result of infrastructure, not an inevitability of maths.
LikeLike
Great info there, Chris. Possibly the whole point of the report was to try and cater for what the ratepayers wanted, and would want in the future. Which of course is the job of all Christchurch City Council employees.
d is a penny. So 2.5 cents for 30 minutes. Five cents for an hour.
LikeLike
No it’s not, it’s to provide impartial technical advice on the implications of different choices, so that elected representatives can then make informed decisions. This report didn’t do that, it didn’t tell outline the different choices avaliable, and what the implications of those would be. It just picked one option that the author liked best and then forced everyone else to go along with it.
LikeLiked by 1 person
1) Travel is just the derived demand of spatial land use allocation. Build a spread out city at low density with mono-use landuse and you get what you would expect – heavy travel demand by private vehicles as many O-Ds are beyond reasonable walking and cycling distances.
2) The costs users face also reflect the demand for private travel – relatively cheap petrol & cheap parking, There were high standard of living in 1959 – NZ had one of the higher living standards in the world then.
3) The separation of land use / transport planning / transport pricing in NZ and most parts of the world simply doesn’t work. All ministries / agencies / authorities of land use and transport & transport pricing need to be merged at each level. Unless there is a holistic approach the fragmented outcomes will continue.
LikeLike