I never noticed before but Stats NZ publish really detailed and up-to-date data on building consents.
I’ve had a play with it in excel and come up with a few visualisation below, which some people may find interesting.
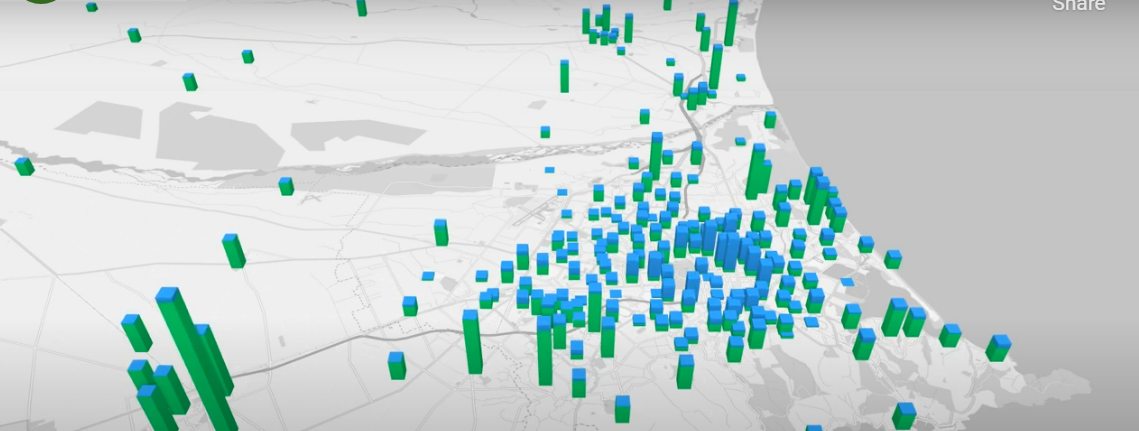
First up, animations showing all residential building consents issued in the last 32 years, split by standalone house versus apartment/ unit/ townhouse/ other. The first shows the monthly consents issued, the second shows the same thing but accumulating over time to give the total consents issued over the 32 year period.
You can see the relationship between the city proper and the satellite towns quite nicely, and the difference in housing type between them.
There’s been a lot of infill in inner suburbs Addington, St Albans and Linwood. A lesser amount in the central city itself. And very little in most of the outer suburbs. Then a bunch of growth on the city fringe but mostly standalone houses in these areas: Halswell, Northwood and Prestons.
Next is the same data but in a simple graph.
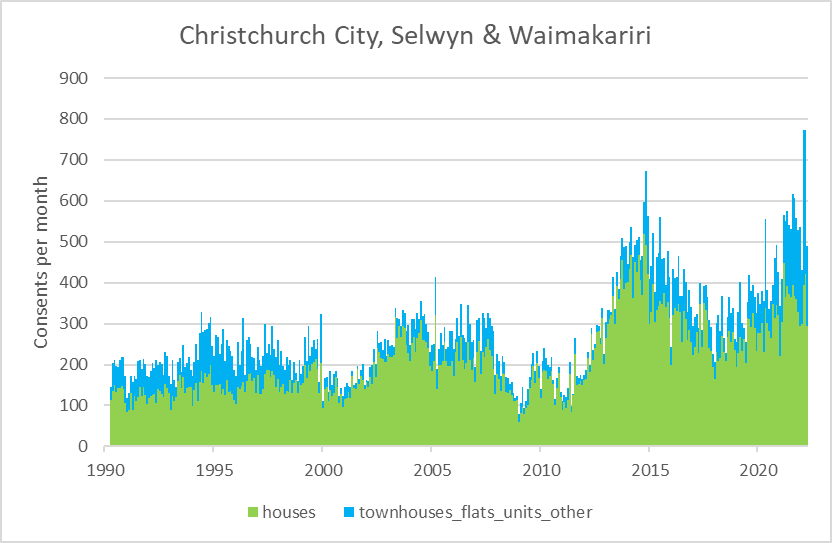

You can see that building is at an all time high right now – we’re building even more homes than we did at the height of the earthquake rebuild. Also of interest is that for most of the last 30 years standalone houses have made up the majority of our building. But in recent years townhouses have made up an increasing proportion. In Christchurch City they overtook houses for the first time this year.
Next is a simple stacked column chart showing the numbers for 2022 across the three districts.
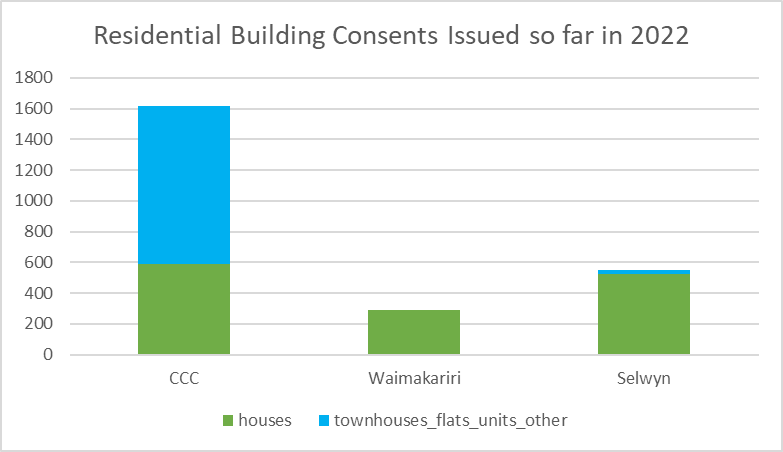
Christchurch has had the bulk of the new housing, Selwyn next, then Waimakariri. Housing type is very different across these. Waimakariri is literally 100% standalone houses, Selwyn is close but does have a handful of other homes. Only Christchurch City has any meaningful number of other home types, with multi-unit dwellings making up a comfortable majority.
