I hear a lot of comparisons between different cities in New Zealand. “Wellington has trains, why don’t we?”, or “Christchurch is getting heaps of cycleways, why isn’t Wellington?” “Auckland’s public transport is booming, why isn’t Christchurch’s?” etc etc.
But each city is so different to each other, it’s hard to know if the comparisons are valid or not. I thought I’d take a closer look at how our biggest cities differ from each other, and how they are the same.
The populations of New Zealand’s 10 biggest cities (as of 2017) are:
- Auckland 1,534,700
- Wellington 412,500
- Christchurch 396,700
- Hamilton 235,900
- Tauranga 137,900
- Napier-Hastings 133,000
- Dunedin 120,200
- Palmerston North 85,300
- Nelson 66,700
- Rotorua 58,800
(source https://en.wikipedia.org/wiki/List_of_cities_in_New_Zealand#Urban_areas_by_population)
Interestingly the population of Auckland (1.5 million) is roughly the same as the populations of the other nine cities on the list combined (1.6 million), which in turn is roughly the same as the rest of New Zealand (1.7 million).
I thought I’d focus on the largest four; Auckland, Wellington, Christchurch and Hamilton.
First I mapped the four city street networks at the same scale, with concentric circles at 5km intervals from the cbd.


I think even this simple exercise shows some interesting things. Firstly, Auckland stands out as being a different scale to anywhere else in New Zealand, with a lot more black area (dense street networks are pretty much equivalent to developed areas).
Secondly, despite Wellington and Christchurch being basically the same population, they couldn’t be more different in form. Christchurch is a very compact circle of development clustered almost entirely within 10km of the centre, with only a few small blobs further out (e.g. Rolleston, Rangiora). On the other hand Wellington is almost like someone hurled a handful of sticky urban goop at the bottom of the North Island in a northeasterly direction, with the bulk landing at Te Aro, but two good-sized splatters spraying firstly up the Hutt Valley, and secondly up through Porirua to the Kapiti Coast. Less than half of the developed land is located within 10km of the centre. The Hutt Valley extends 35km away, and the Kapiti Coast just keeps on going – most of it doesn’t even make it onto the map.
Below is another way of looking at this – a graph of population versus distance from the centre (this is one I did a while ago based on Census 2013 data, I didn’t do Hamilton because back then I didn’t realise how big it has gotten).
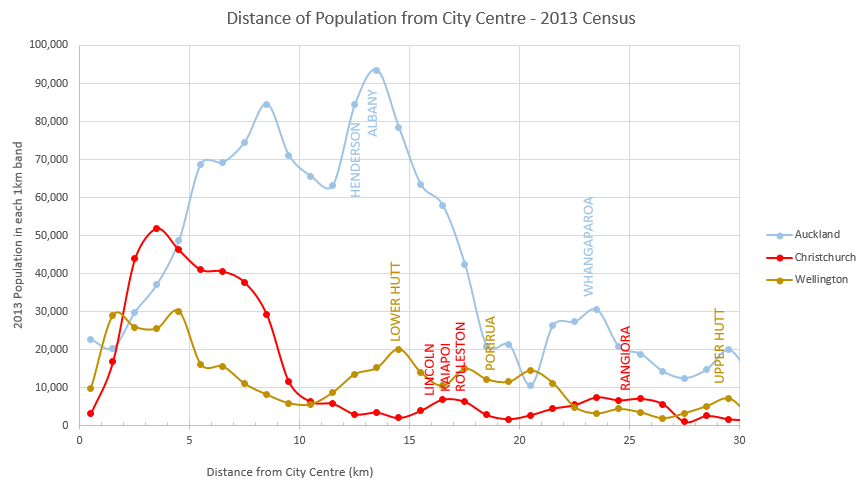
This highlights the same two points. Firstly, Auckland is a different beast to anywhere else in Aotearoa (the area under the blue line is much larger than the areas under the red and yellow lines. Secondly, Christchurch is very compact compared to both Wellington and Auckland. Almost all of its population lives within 10km of the city centre. Despite its low density of development, and despite 2013 being only just after the earthquakes which completely destroyed it’s CBD, it still had more people living within 4km of the centre than both Auckland and Wellington.
Next post: So what does this mean for transport?
What stands out to you when you look at these maps and graphs?
Edit: added graph below for further info: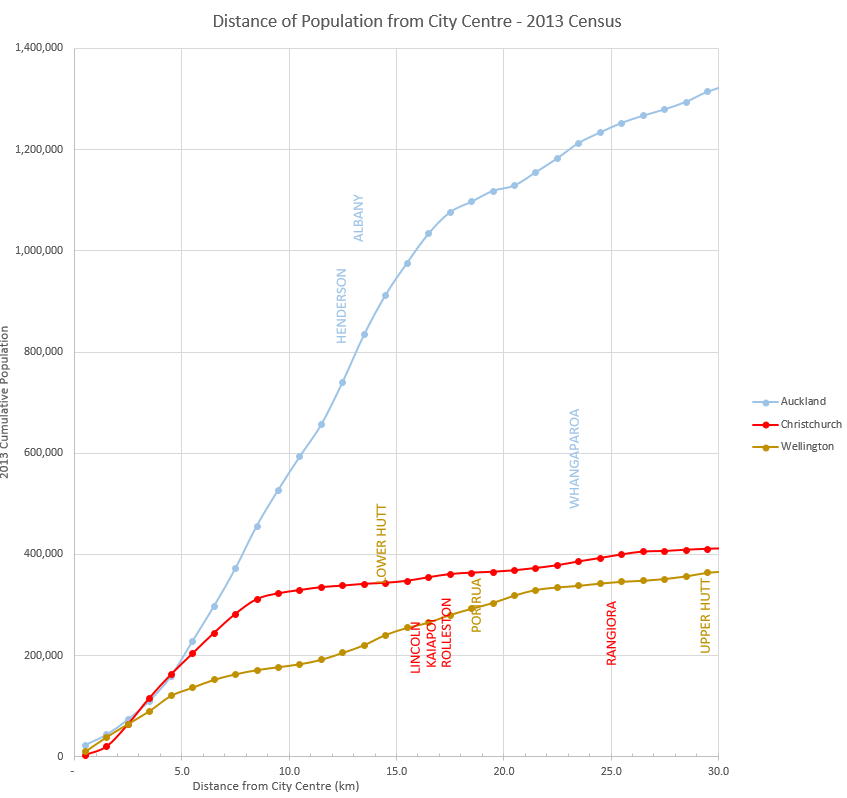

Nice work, but will need to be updated, especially that last chart from 2013; eg Akl city centre is at around 55k now, and growing fast… and when will Chch re-fill its empty heart?
LikeLike
Yep, although chch has changed a lot since 2013, Auckland definitely has too. I think our resident-free cbd is probably the biggest failing of the rebuild, and Auckland’s surge in cbd residents is one of its biggest recent successes.
LikeLike
Yes the 2018 census results will be very interesting. I think this will clearly show that Christchurch has become NZ’s 2nd city -although it is a misuse of statistics not to say that already. How Wellington manages to include lower Hutt, Upper Hutt and Porirua but Christchurch does not include Rangiora, Kaiapoi, Woodend, Pegasus, Rolleston and Lincoln I don’t know. The distances are the same.
LikeLike
True i hadn’t thought of that. These populations are 2017 estimates so hopefully not too different to 2018. But yes there is some inconsistency in where boundaries are drawn.
LikeLike
Apparently the Christchurch “urban area” definition includes Kaiapoi and Prebbleton, but excludes the likes of Rangiora, Lincoln and Rolleston. I think those three alone add about 38,000 people to the picture.
LikeLike
I have seen some estimates of Greater Christchurch’s population being 0.5 million. But nothing official. NZ getting a second city of over 1/2 million would be an important milestone. There should be some effort put into accurately calculating this figure.
LikeLike
Chris is it possible to calculate the population area under your 2013 graphs for Christchurch and Wellington for everything under say the 30km radius circle?
Or maybe have a cumulative total pop line graph of the two cities? With pop on the y axis and distance on the x axis?
LikeLike
Yep I already did a graph like that – have just added it on the bottom of the article. It does actually show Christchurch clearly being larger than Wellington.
LikeLike
Also although there are some differences between Christchurch and Wellinton. There are some similarities. They both have two main transport corridors branching off its urban core.
Porirua and Kapiti could be seen as the equivalent of Waimakariri transport corridor and the Hutt valley is the equivalent to the Selwyn corridor.
Christchurch’s urban core is bigger but outward expansion has been reached on most sides. By the sea. Waimak river and north-east marsh land liquefaction prone land. Airport and unconstrained acquifer land to the west north of West coast road and Port hills to the South.
Greater Christchurch has not had the transport investment in the two corridors branching off its urban core compared to Wellington. So far outward growth is completely car dependent.
If Greater Christchurch got the multi-modal transport investment that Greater Wellington has received in trains etc then this would benefit both the centre of the urban core and the two branching corridors because growth would be more balanced.
LikeLike