The numbers are in and it’s a lot! The short story is that the number of people riding their bikes in the city continues to grow strongly, with 2024 recording more than ever before. Council did a press release here: below is my interpretation of the numbers using a more basic methodology.
As a reminder, there is a network of 32 electronic bikes counters around the city, mostly on major cycleways. They automatically count the number of people bikes going past and immediately publish the numbers online here for everyone to see. They are calibrated to not count scooters or any other devices.
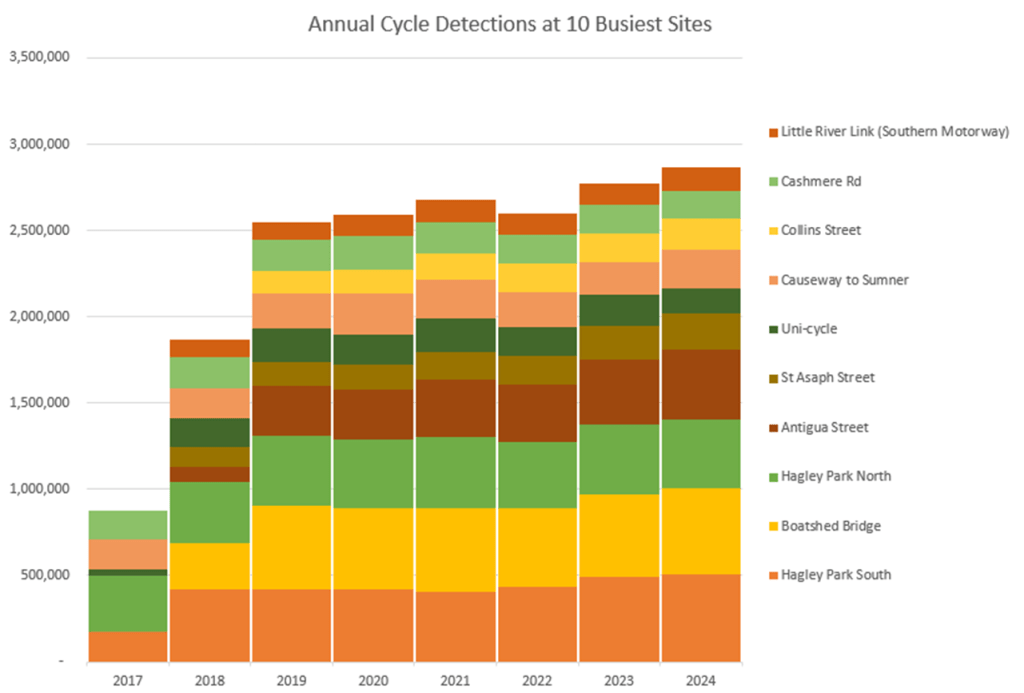
I’ve focussed just on the busiest ten of these counters and graphed their annual numbers below. These ten sites combined recorded a total of 3.1 million bicycles over 2024, 4% higher than 2023. Over the last five years we’ve seen fairly steady growth averaging 2.7% per annum. 2022 is the only year that bucks this trend being quite a lot lower than you’d expect: I’m not sure what was going on in 2022 to cause that but whatever it was seems to be gone now.
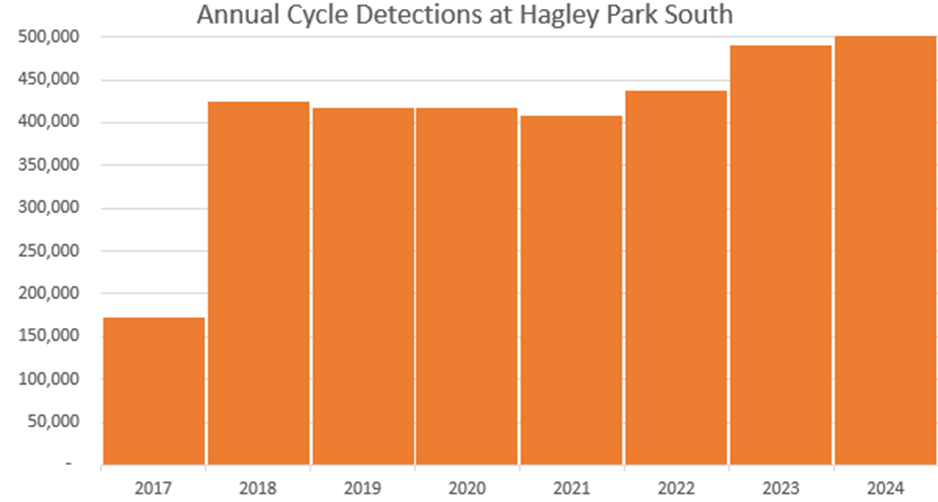
Hagley Park South has held onto its title as the busiest spot in the city for people riding bikes, just edging out the Antigua Street boatshed bridge. Interestingly it recorded slowly declining volumes for three years in a row between 2018 and 2021, but then flipped 180 degrees and has grown a whopping 21% over the last three years.
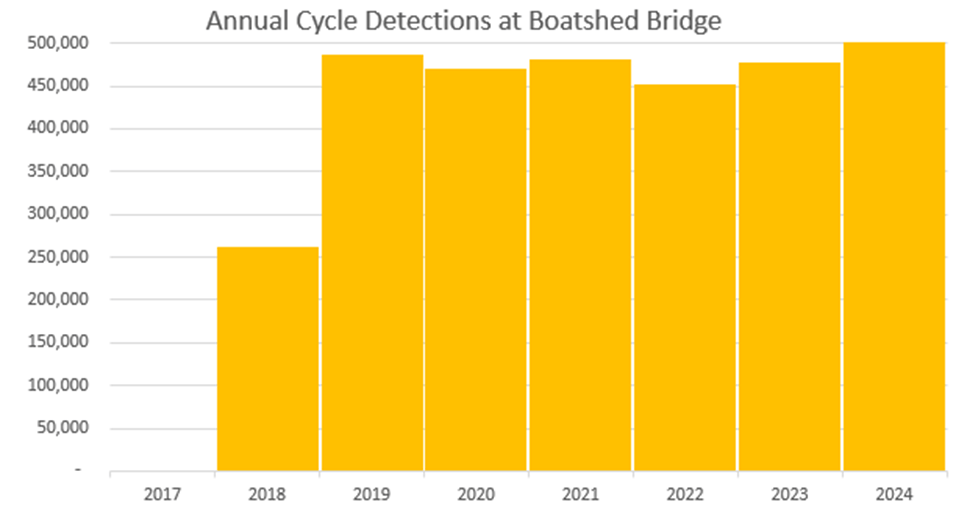
The Antigua Street boatshed bridge counter recorded its highest ever number and broke half a million for the first time ever. However even that wasn’t enough to overtake Hagley Park South so still sits in second place for now.
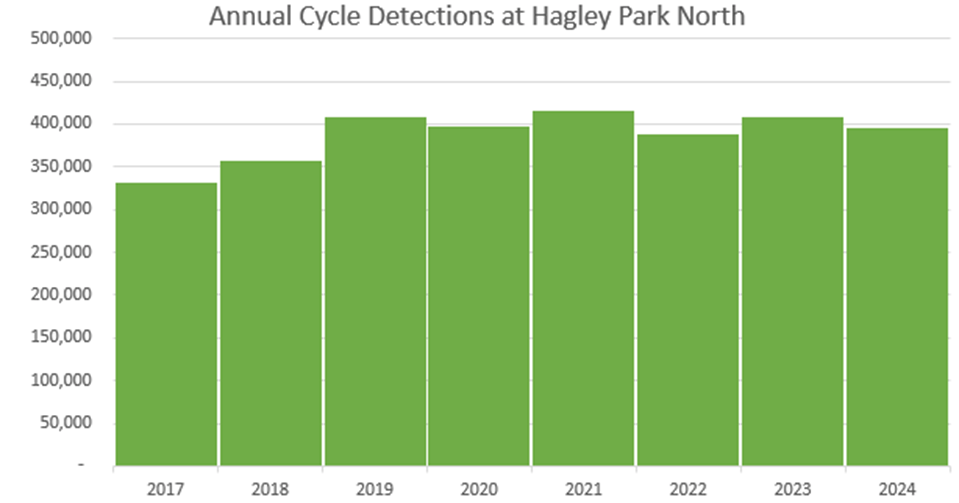
Rounding out the podium is Hagley Park North. Unlike Hagley Park South, it fluctuates a lot more, with a drop recorded in 2024 compared to 2023. One thing that may be influencing this one is that the location of the sensor is more prone to disruption, with the area often being fenced off when there are big events like Electric Avenue happening.
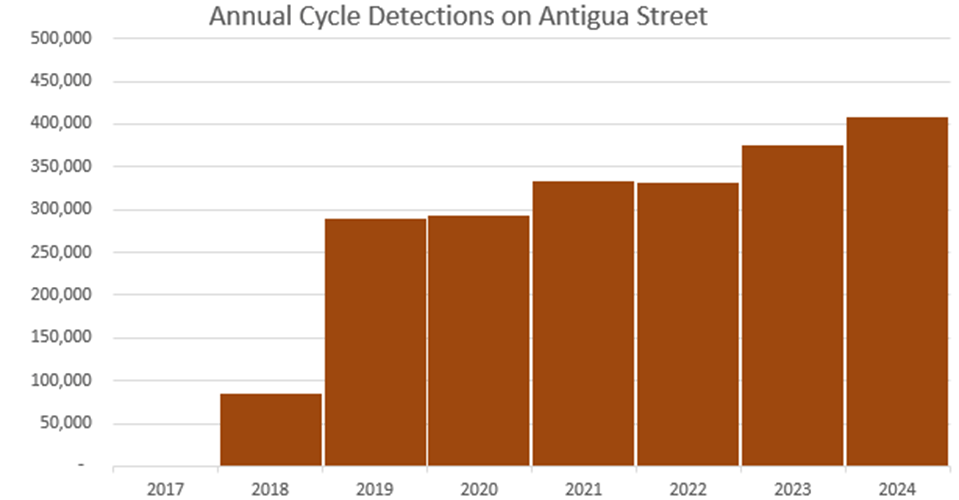
Antigua Street continues to grow strongly, with 100,000 odd more people biking down it in 2024 than did 5 years ago in 2019. This is very much the “network-effect” in action, with several other cycleways being built in that time further upstream and feeding into it.
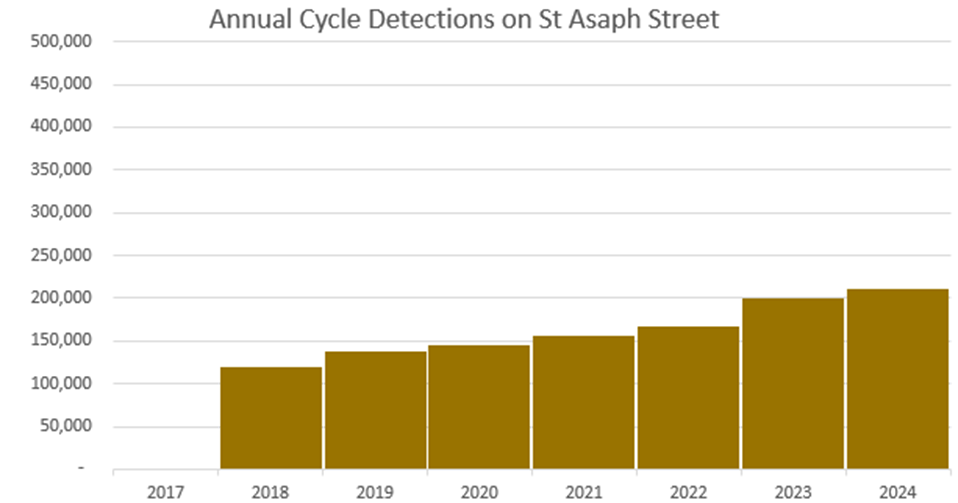
St Asaph Street continues to grow steadily, with roughly double the number of people riding down it now than did 6 years ago when it opened.
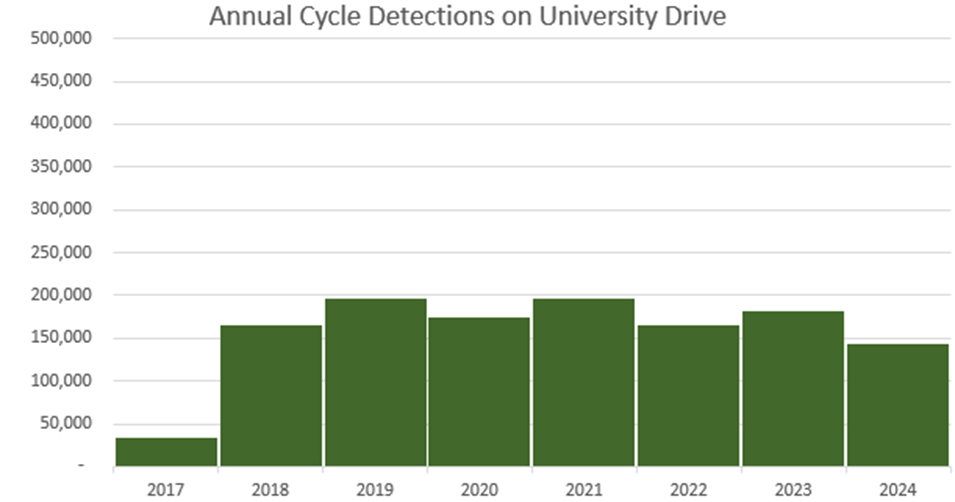
University Drive continues to perplex, fluctuating wildly over the last few years. Initially it was easy to brush off as covid-related, but 4 years on I’m not sure that’s still the case. There might be something else going on here, although I don’t know what. The sensor is in a slightly awkward spot between two intersections and a signalised crossing. Perhaps moving it to a mid-block location might get data more in line with what you’d expect to see?
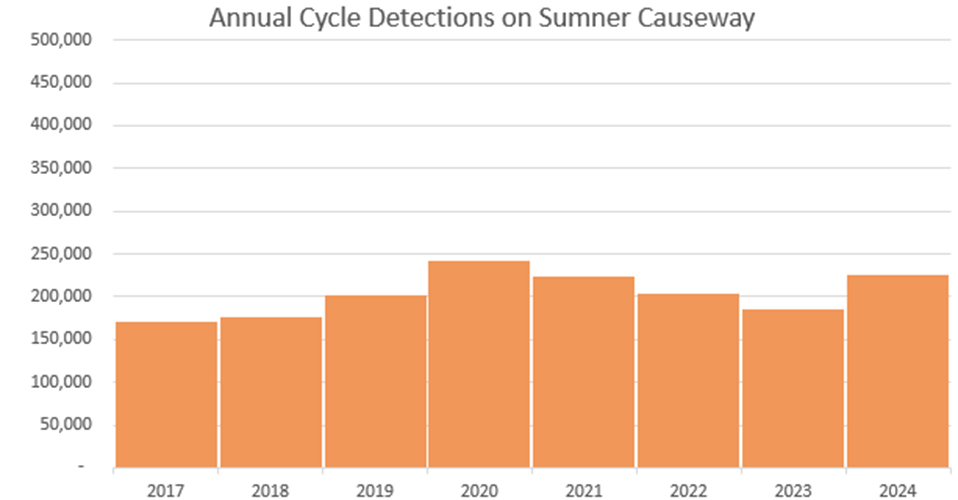
Main Road leading up to the Sumner Causeway bounced back a lot in 2024 after completion of the coastal pathway late 2023. The numbers still didn’t reach the lockdown-related peak of 2020, but it wasn’t a million miles off.
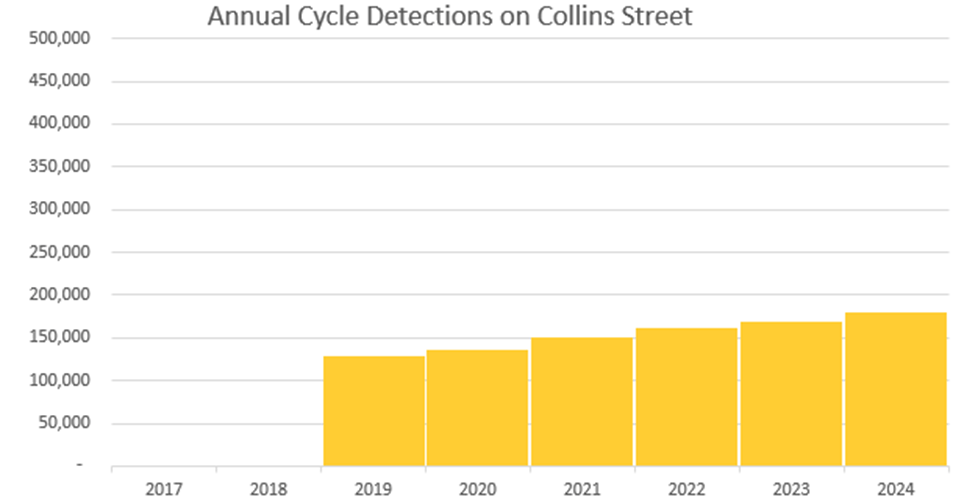
Collins Street continues to grow steadily.
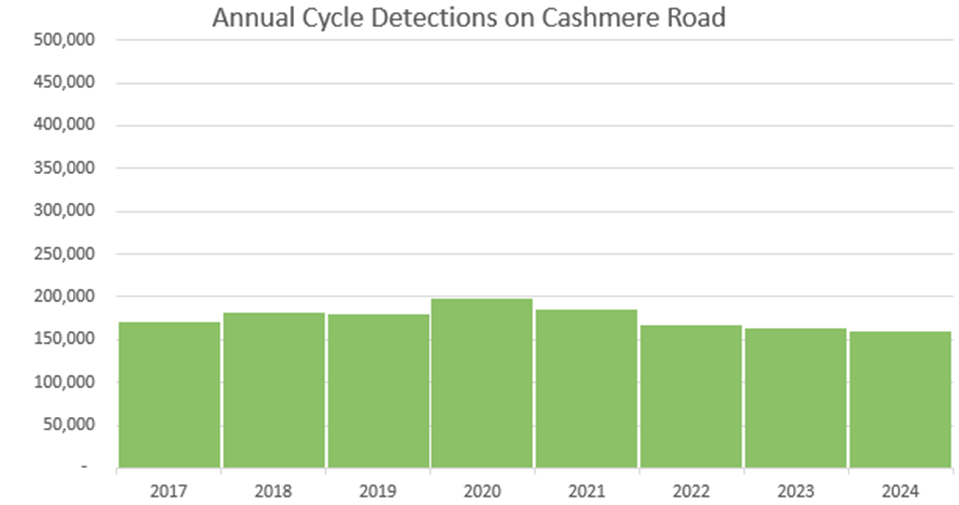
And conversely Cashmere Road continues to decline steadily. This is a weird one – it’s the only sensor in the city with clearly declining numbers over the last five years. Having said that it had been growing strongly prior to 2020, so it’s still sitting at similar volumes to where it was in 2017. The location is unusual in that it is more popular for recreational riding than riding to get from A to B, so perhaps there are some insights to be drawn about the growth or not of recreational cycling compared to just riding to get around the city.
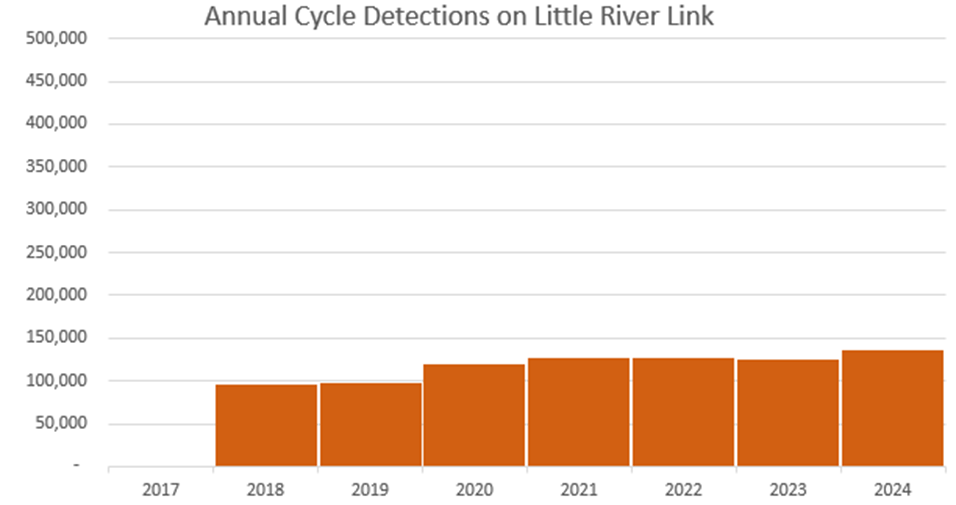
Little River Link continues to grow steadily.
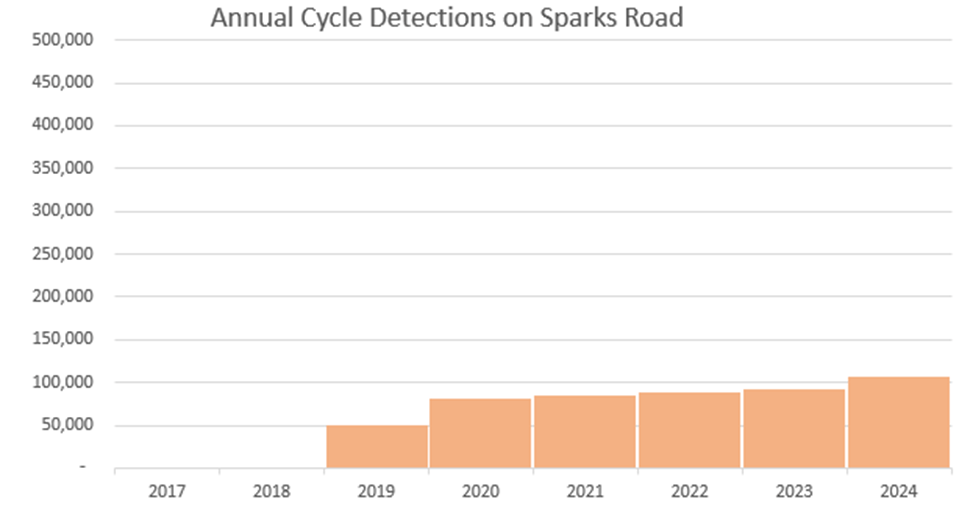
So that’s the top ten sites. To finish off, I thought I’d take a look at the Sparks Road counter as well. This one is dear to my heart as it’s the one I use on an almost daily basis, it’s close to my house, and it services my childrens’ primary school. From my own observation it seems to be utilised mostly by school kids and their parents. This counter has seen very high growth, with the total number of people riding past it being 17% higher than in 2024, and 108% higher than in 2019 when the cycleway first opened. On the ground that means that each day somewhere in the order of 70-80 more people are riding their bikes that were not in 2019. A lot of those will be children getting to and from school. In my humble opinion, that is a massive win for the kids, a massive win for their parents, and a massive win for the wider community. Certainly from a personal perspective it’s made a huge difference to the mental and physical health of my children and me.
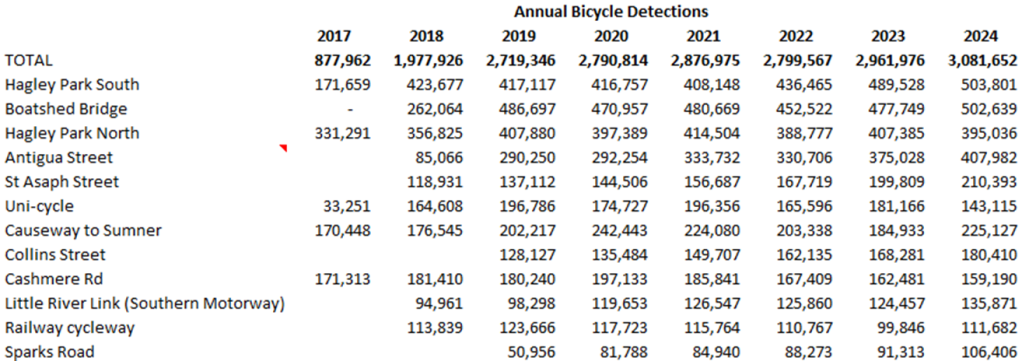
Here are the exact numbers if anyone is interested.