Welcome back everyone – I hope you’ve all had a good Christmas and new year.
It’s been a long time since I last looked at cycle counts around Christchurch (here and here), so thought I’d delve back into it again.
Remember that Christchurch now has a network of electronic sensors that count the number of bicycles passing over them 24/7 and automatically publish the numbers online (here). There are 24 locations covering the busiest cycle routes. These sensors are calibrated to only pick up bicycles – they don’t record scooters, e-scooters, prams etc.

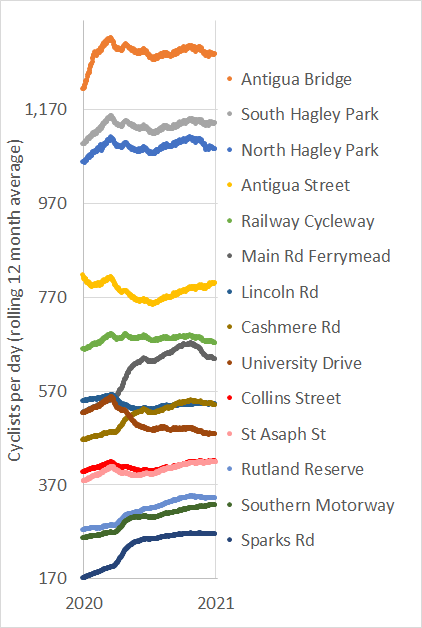
I’ve graphed the data from the 14 busiest sites below. I’ve fixed up some gaps in the data and used a rolling 12-month average to take out the seasonality aspect. So each point in the graph below shows the average number of cyclists each day in the preceding 12 month period. Two of the sites (Antigua Street and Lincoln Road) only have sensors in one direction, so I’ve doubled their numbers to estimate the two-way cycle number.
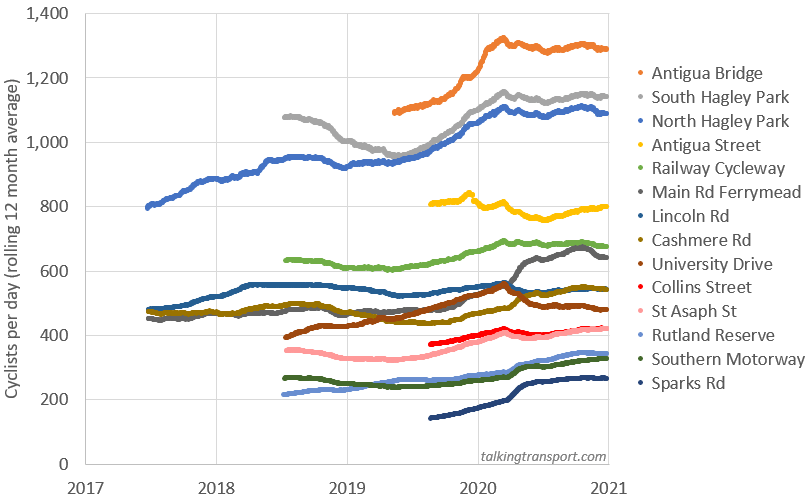
There is a strong upward trend. The covid lockdowns have had some effect with the 2021 growth being slower than the 2020 growth – but it is not really that obvious. I had half-expected to see the 2021 figures plummet to almost zero, but that didn’t happen. The total number of cyclists recorded at all sites grew 7% in 2020. The equivalent growth in 2019 was 11%.
The three busiest sites – Antigua Bridge, and north and south Hagley Park, are all growing strongly.
Some of the smaller sites have seen big growth too – the Sparks Road cycleway (Quarryman’s Trail) had an average of 140 cyclists per day in its first year of operation, over 2020 it averaged almost double this at 264 cyclists per day, despite the schools it services being closed for a good chunk of the year. To me this confirms that there is indeed a latent demand for cycling that is currently being suppressed by a lack of safe streets, especially around schools. This always comes through very strongly in the qualitative work (NZ parents say that they don’t let their kids bike to school because it’s too unsafe). It’s reassurring to see that when we make our streets safe to bike on, people do change their behaviour.

The University Drive counter is the one that is the most obviously hit by the lockdown – through 2019 it was one of the fastest growing counters before abruptly dropping off in March 2020, and struggling to get back up for the rest of the year.
Cashmere Road had big growth in 2020. I wonder if this reflects the higher numbers of recreational cyclists who got out during lockdown.
Lincoln Road has bucked the trend of most of the count sites, with cycle numbers staying flat throughout the entire 4 years we’ve been counting it. Lincoln Road is a busy arterial with several big, multi-lane signalised intersections. It has painted cycle lanes but no physical separation. I wonder if the lack of cycle provision is limiting growth here, and whether we would see growth similar to the other sites if only there was physically separated cycle facilities. Next year CCC will be building bus lanes through Addington Village which cyclists will share. I know there’s different views as to whether cyclists sharing bus lanes is a good or bad arrangement. It will be interesting to see if this arrangement on Lincoln Road results in any change to the number of people cycling down here.
Does anything stand out to you about these cycle numbers?

The Lincoln Road/ Moorhouse Ave intersection is very slow for cyclists and quite scary.
LikeLike
It’s good if you’re going along the cycleway (Hagley Park Grove Road) but yea it can be daunting for other movements.
LikeLike
Well that is spooky, earlier this week I finished writing a Cycling In Christchurch blog post about Chch cycle counts, it’s coming out on Sunday…
LikeLike
Spooky – look forward to reading your one!
LikeLike
PS feel free to republish this one too.
LikeLike
Nice article. Regarding Lincoln Road, my prediction is that the bus lanes will result in an increase in cycling on this corridor. Clearly, going through Addington is not for the faint-hearted at present and once the bus lanes are in, people cycling will have more space.
LikeLike
I certainly hope so! There is one counter on Main North Road amongst bus lanes – I might have a closer look at that one in a future post.
LikeLike
Nice article. Regarding Lincoln Road, my prediction is that the bus lanes will result in an increase in cycling on this corridor. Clearly, going through Addington is not for the faint-hearted at present and once the bus lanes are in, people cycling will have more space.
LikeLike