
Stats NZ recently held a competition to see who could come up with a “cool, interactive visualisation of 2018 Census data about the way people commute to work and education“.
The winner was announced as Jono Cooper, who came up with the Waka Commuter app now available here.
I had a play with it and have some screenshots below, but I’d encourage you to go check it out yourself.
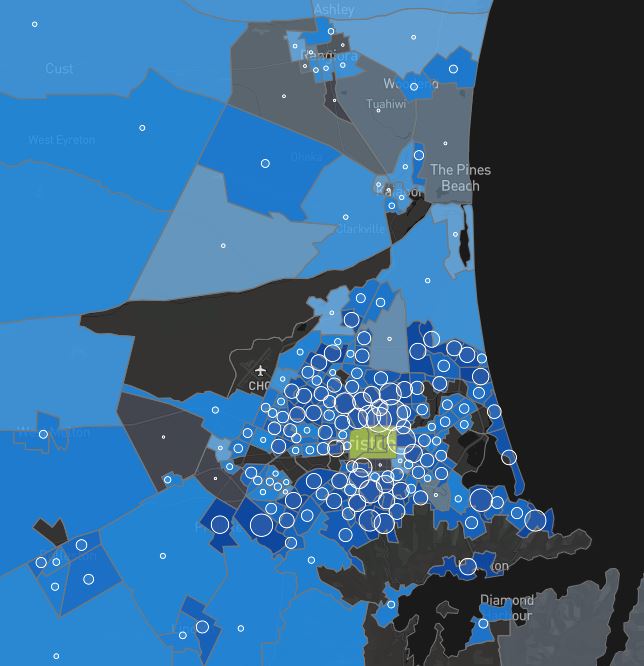
This graphic shows where central city workers commute from. At a high level you can kind of see most come from the inner suburbs within a few kilometres, with relatively small numbers coming from afar. Despite Rolleston and Rangiora being similar sizes, far more Rollestonites work in the central city than Rangiorians.
And here is some further break down.
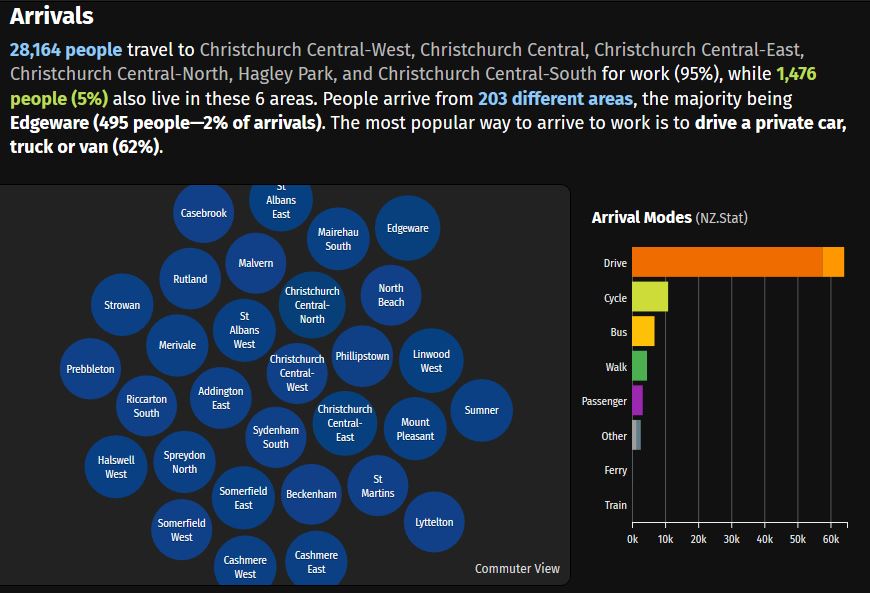
Key points are that, as at the 2018 census, about 28,000 people worked within the 4 Aves. Prior to the earthquakes about 40,000 people worked in the central city.
It shows again that most people are coming from the inner suburbs immediately surrounding the 4 aves.
Most people drive, although at 62% this is well below the city average mode share (about 83%).
A fairly respectable 12% bike to work. Keep in mind that the phrasing of the question in 2018 changed to only capture the primary mode of travel, so this 12% will be significantly lower than the actual number of people riding bikes to work each day.
Only 7% catch public transport, well below the public transport mode share that most cities Christchurch’s size have.
Only 1,500 of those central city workers live in the central city (5%). This is really low as well (Auckland and Wellington both sit at about 13%).
I also had a play with the area I live in – Hoon Hay East (the green block below).
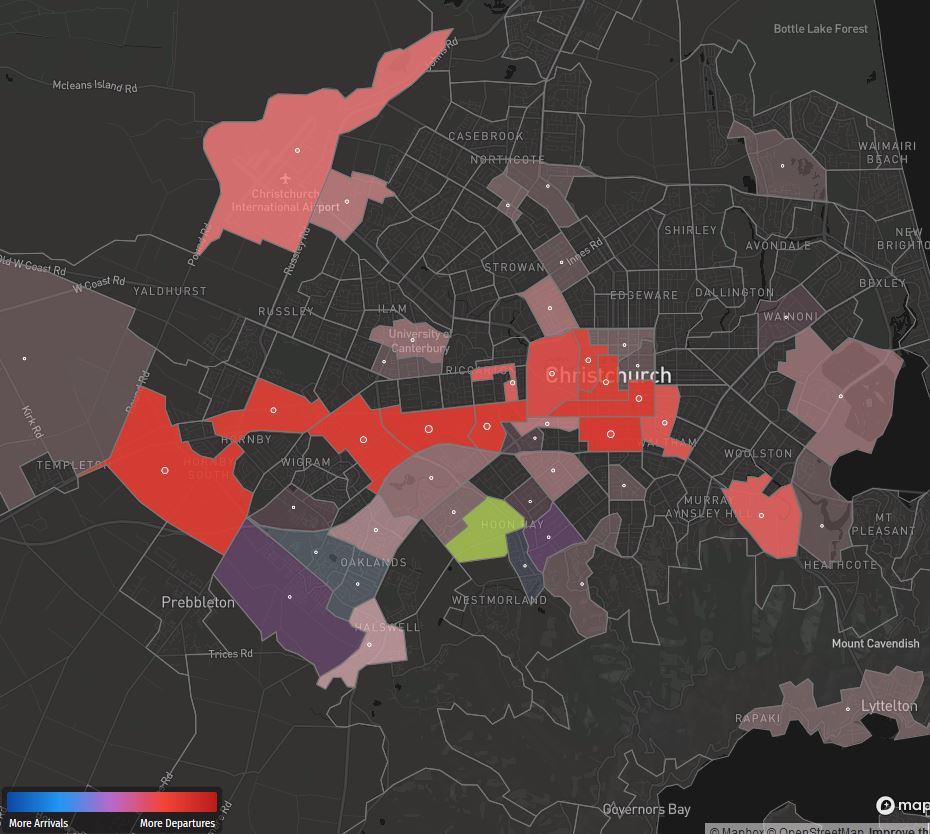
Red areas are where residents of Hoon Hay East go to work. I was quite surprised how dispersed it is. The central city is the strongest area, but the southern industrial belt and the airport are also both pretty strong.
1,150 people leave Hoon Hay East every morning for work, while only 48 arrive. Hoon Hay East is basically a monolithic block of housing. There is no employment other than 2 primary schools, 1 pre-school, a medical centre and a petrol station. This type of monolithic zoning forces everyone to travel longer distances to get to work.
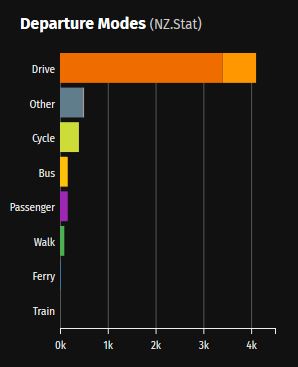
76% of people drive to work, 9% are Other (which is mostly work from home), 7% bike, 3% bus and 2% walk.
I’d suggest this is pretty typical of most of Christchurch, and is a reflection of both the type of city we’ve chosen to build (dispersed, low-density, with monolithic blocks of single-use zoning) and the type of infrastructure we’ve chosen to invest in over the last few decades (mostly roads, motorways and car parking buildings).
