
A couple of months ago Statistics NZ released the 2018 travel to work data (here). Greater Auckland did a post here. I’ve expanded on the Christchurch data here.
The question changed slightly this year from previous years. See if you can spot the difference:
- 2013 question: “On Tuesday 5 March, what was the one main way you travelled to work – that is, the one you used for the greatest distance?”
- 2018 question: “What is the one main way you travel to work – that is the one you use for the greatest distance?”
It’s only 4 words removed, but those 4 words have a significant impact on the results. Many people are not mono-modal – sometimes they drive their car, other times they catch the bus, other times they ride a bike or walk, depending on the day, the weather, their mood, childcare etc. With the 2013 question, this tended to get balanced out whereas with the 2018 question there will be a bias towards the mode they use the most. Here’s a simple illustration:
- Let’s say that 100,000 people drive to work 4 days a week and catch the bus 1 day a week, evenly split across Monday to Friday.
- With the 2013 question, 80,000 people would tick the “drive” box, and 20,000 would tick the “bus” box, and the reported bus mode share would be 20%.
- With the 2018 question, all 100,000 would tick the “drive” box, and zero would tick the “bus” box, and the reported bus mode share would be 0%.
So 2018 is not comparable to previous years and you need to be really careful taking anything from the travel to work stats, particularly around modes which people use sporadically.
Cycling Christchurch talked here about the fact that the number of people answering this question with “cycle” was lower in 2018 than 2013. It’s hard to know for sure, but my take of the numbers is that this does not mean there are fewer people cycling. In contrast, if we adjust the number based on what we know about how many people are multi-modal (from other sources like the MoT travel surveys) then it suggests there are significantly more people cycling in Christchurch in 2018 than 2013.
In respect to bus mode share, 8,300 people living in Christchurch (excluding Waimakariri and Selwyn) said they usually take the bus to work, out of a total of 173,200 people who travel to work (4.8%). Again, the actual number taking the bus on any given day will be higher than this. But it’s still low – much lower than Wellington and Auckland. For comparison, 11,160 people said they usually cycle to work and 7,700 usually walk/jog.
The map below shows active mode share by home address. This is people walking/jogging and cycling, but I’ve also included the “other” category as I assume this will be mostly people doing things like scootering/e-scootering and skateboarding/e-skateboarding. The purple areas are regions where 0-5% of residents use active modes to travel to work, blue is 5-10%, green 10-15% and yellow over 15%. Grey areas are those with minimal people living in them (<200). Black lines are core bus network.

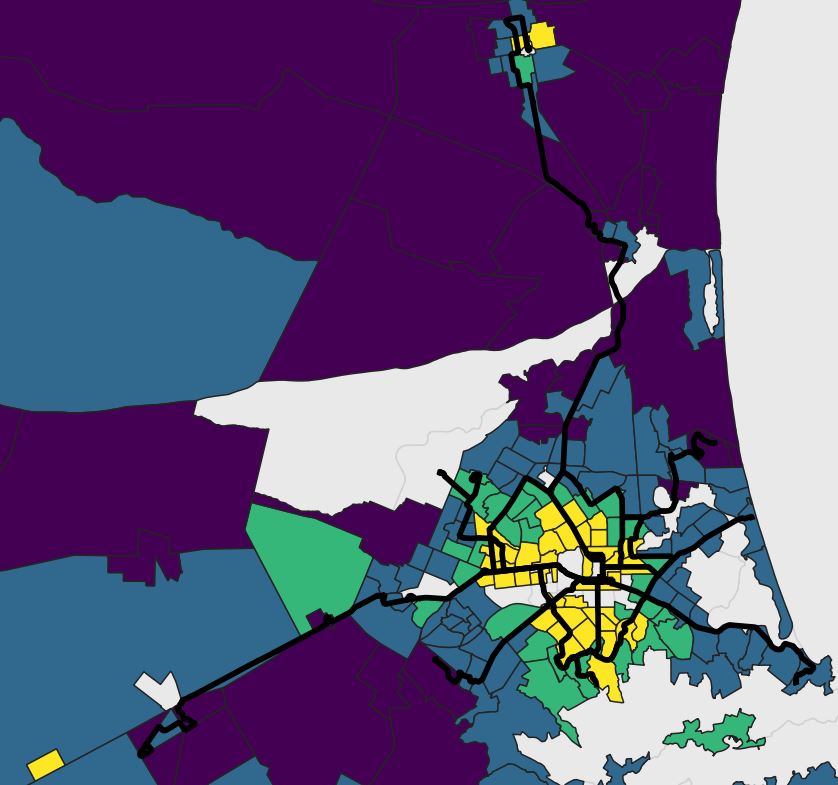
It shows that typically people living within a few kilometres of the city centre are more likely to walk and bike to work, while those living out in the wops are less likely. Which is fairly intuitive. The exceptions are the Burnham Military camp and a patch of Rangiora. Diamond Harbour has quite a lot of active mode travellers too given its distance.
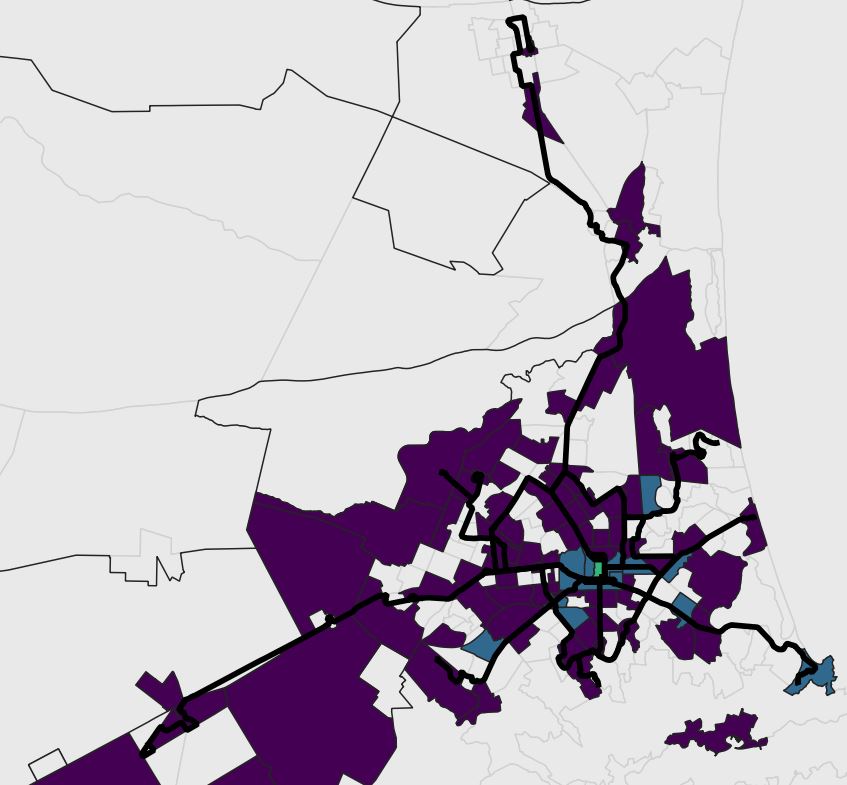
Here is the corresponding map for bus mode share.

The thing that strikes me first is that bus mode share is much lower than active mode share in Christchurch. There are various reasons for this, but I think the most important one is simply that we’ve invested in active modes (cycleways), whereas we have not had corresponding investment in public transport (we spend far less per capita than Auckland and Wellington do).
The central city and Riccarton stand out as the highest bus mode share, followed by most of the inner suburbs. This is fairly intuitive as these are the densest areas with least space for parking and traffic, and correspondingly have the best bus service. A stand-out exception is the inner suburbs in and around Fendalton in the inner northwest. I actually find this really interesting. In Christchurch, there is still a positive correletion between deprivation and bus use. Wellington shifted away from this a long time ago, with people of all walks of life using the bus network rather than just those who can’t afford cars. Auckland has more recently made the shift. I wonder how long it will be before Christchurch gets up with the play on this.
The maps below show the same thing but defined by the person’s work address rather than their home address. Areas with few employees are excluded (white).

The hospital has the largest active mode share at around 18%. I don’t think it’s a coincidence that it is just about the the only part of the city that doesn’t have masses of ratepayer-funded car parking (yet). If certain councillors get their way and build a big free taxpayer funded carpark, we should expect to see this drop.
Burnham military camp comes in an unexpected but logical second, and then the rest of the city centre follows.
The following is the same map but for bus mode share.
Again it’s obvious that bus mode share is low city-wide. Employers in the central city are highest but still only 11%, which is lower than what I had expected to see. The hospital is up there again. There are a few wee clusters of higher bus mode share: Sumner, Hillmorton, Addington and Shirley.
Overall, my key takeaway is that Christchurch has made some good ground with active modes in the last few years, but is lagging badly with its public transport.
Anything stand out to you about these?

The change in wording between 2013 and 2018 is unfortunate (deplorable?), and counter to the purpose of a census (a census is not a survey, and that question reads like a survey question). Nevertheless, it still paints a damning picture of the state of PT in Christchurch. Despite all the publicised troubles with Wellington’s bus network, for example, patronage has actually increased since (with improvements to come).
My main observation/musing, in addition to what you have outlined, is that there seems to be a serious problem with the way the city’s transport policies are being set. Parking issues are still parking issues, PT issues are still PT issues, etc. When Auckland started looking at transport issues through a whole-of-system lens, it made that transition away from a positive correlation between deprivation and PT use as it wasn’t making decisions on issues in isolation. A perceived parking problem might not necessarily require a parking solution. Until Christchurch starts thinking like that, it will continue to scratch its head and wonder why it isn’t seeing the outcomes it desires and needs.
Other things to note are the low PT use in Waimakariri and Selwyn – I would have thought you could capture that quite well with well placed interventions given distance and the booming populations/traffic – and the general failure of 15 minute frequency bus routes to capture passengers, even where there is bus priority (e.g. Papanui/Main North Rd). The only exceptions are Riccarton Rd (two high frequency routes along its length + a third for some of it) and areas of higher deprivation. If anything, this perhaps help illustrate my point above.
LikeLike
Agree but don’t know how to fix that. Is the solution a transport authority? Or can we work with the system we have and just do it better?
LikeLike
I think a transport authority is certainly desirable for many reasons, but, regardless, perhaps one area that needs to be seriously looked into is capability. Is there the right mix of experience, skill, and diversity of ideas and views within the current system? Given Christchurch’s background as a car-dependent city, and that it has largely relied on small/minor incremental improvements to its bus network over 30 years for
barely any mode-shift, this is potentially a big problem. Getting the right people, and giving them some license (within reason) to have a blank slate within which to make recommendations, is crucial to bringing on change.
LikeLiked by 1 person
Another thing I’ve observed is that often problems are dealt with case by case rather than as part of a city wide policy. Which leads to a hodge podge of different treatments around the city depending on how powerful the neighboring individual land owner was. Need stronger citywide rollouts.
LikeLike
Another thing I’ve observed is that often problems are dealt with case by case rather than as part of a city wide policy. Which leads to a hodge podge of different treatments around the city depending on how powerful the neighboring individual land owner was. Need stronger citywide stance on key transport issues.
LikeLike
Agreed. I think in addition to a lack of capability there is also a lack of leadership on transport issues. It’s both a top down and bottom up problem, and it leads to a lack of vision, and these sorts of mish-mash outputs that only result in poor outcomes. Where’s the cohesive strategy? Where are the key interventions? This stuff is second nature in Auckland and Wellington, and it’s why they get the big bikkies from central government and Christchurch doesn’t.
LikeLike
My perception is that multi-modes commutes are more common. Increased parking fees, disruption as a consequence of road works, improved infrastructure for active transport, (shared) micro-mobility options, congestion probably all have roll to play in this. It is a real shame that Stats NZ does not acknowledge this. We can never get a correct answer if we ask the wrong question. Even if they correct this in the next census it will take quite few years before we know how significant this trend is.
LikeLike