In March last year I wrote two posts about the high volumes of bicycles that were being recorded at the time (here and here).
The January and February figures were really high, and I pondered at the time if that was a sign the rest of 2023 would be high as well. Now that 2023 is done I’ve gone back and looked at the total volumes across the whole year.
If you’re new to this, Christchurch City Council has been busy installing a network of bicycle detectors around the city, most of them on the major cycleways network being rolled out. All the data is automatically published online for anyone to see. The raw data is here, a processed version of it is here.
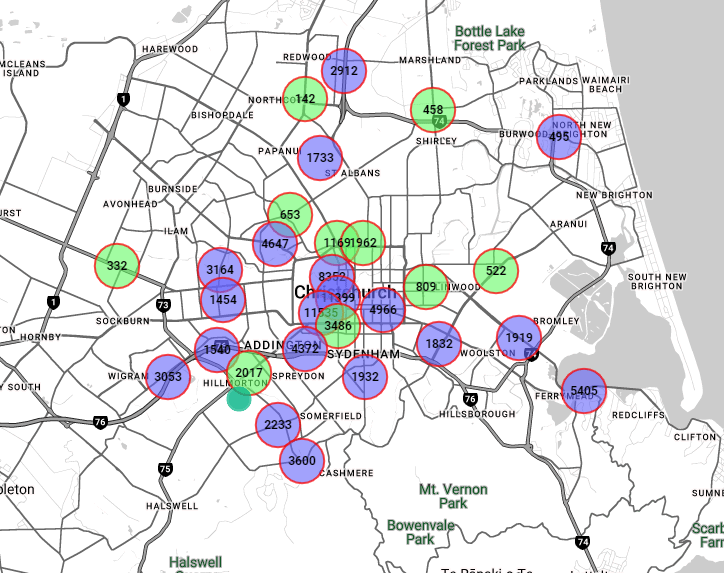

I’ve taken the raw data from the ten busiest sites around the city and looked at their total annual bicycle detections for each year since 2019. The numbers look like this:

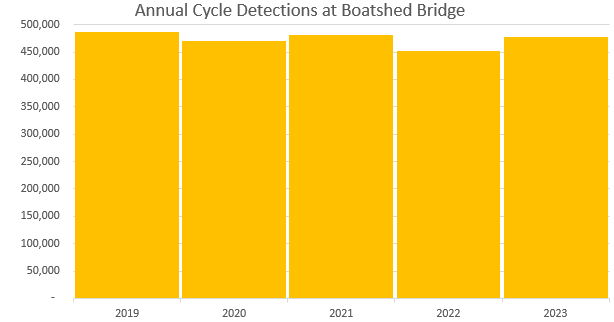
If you graph these numbers you get this:

Up till now the boatshed bridge was always the busiest counter in the city, but in a significant move Hagley Park South has overtaken it in 2023. Only time will tell if this is an anomaly or a permanent shift on the leaderboard.
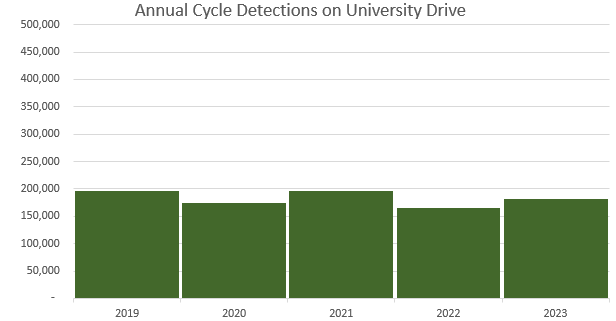
Three other sites also had their busiest year in 2023: Antigua Street, St Asaph Street and Collins Street. Others not so much; the causeway to Sumner was down last year, I assume due to construction of the Coastal Pathway closing this route for a period. Numbers on the uni-cycle have been all over the place through covid and still don’t seem to be quite back to normal yet.
These ten sites together recorded about 2.55 million bicycles in 2019, in 2023 it was up 9% to a new high of 2.77 million bicycles.
All up there is a clear picture of more people choosing to bike around the city. This is consistent with the graph earlier in this post which uses a different methodology to reach the same conclusion.
I’m already looking forward to seeing what the 2024 numbers will show. My prediction would be a big bump in the Sumner numbers due to the recent completion of the coastal pathway, steady increases in the central city as the post-earthquake drift inwards marches on, and a general citywide lift as broader societal shifts (e.g. fuel prices, cost of living) increasingly make cycling the most commonsense way of getting around the city.
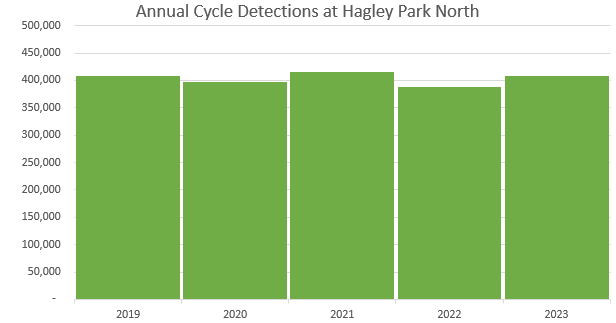
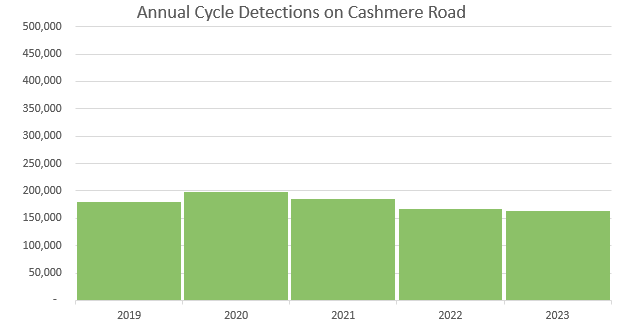
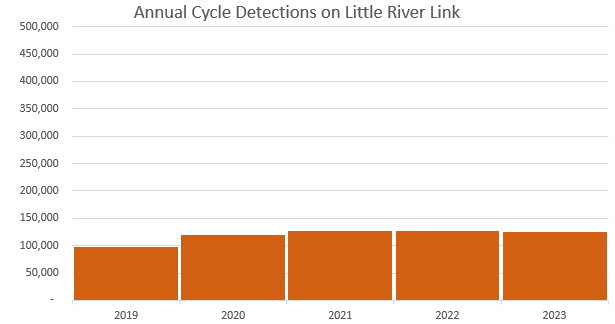
Individual site graphs below.


One thought on “2023 Cycle Counts”