I was recently looking at the Wikipedia page for transport modal share, and found out we’re listed as the number one mid-sized city in the world for driving.
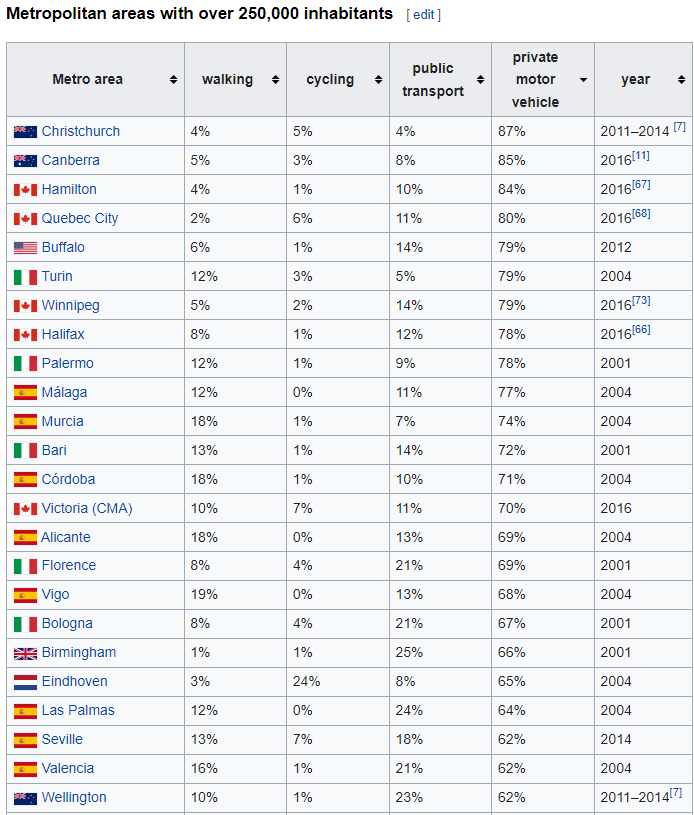

Yay for us. The average city has around 55% of its trips made in vehicles and 45% made by walking, cycling and public transport.
Our split is 87/13%.
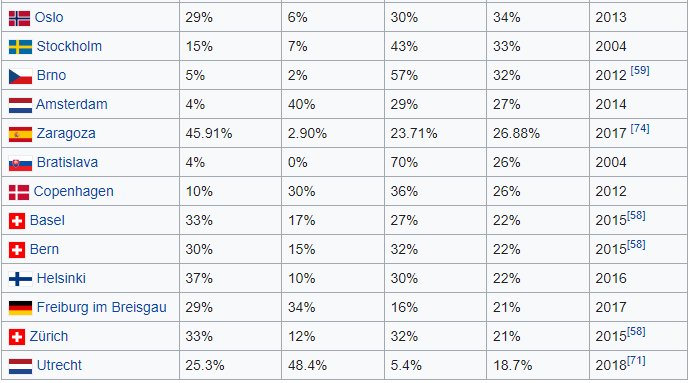
You might argue that it’s a New Zealand thing and most of the cities with different mode shares are European. Except for the fact Wellington is in there, sitting not far off the average at 62%.
Getting our mode share to the same as Wellington over the next eight years is roughly what is needed to meet our climate change targets. Do you think we’ll do it?

The optimist in me says we can. There’s nothing technically difficult about it, just politically difficult. If people collectively want to do it then we will. But if we do, I think our mode split will be different to Wellington.
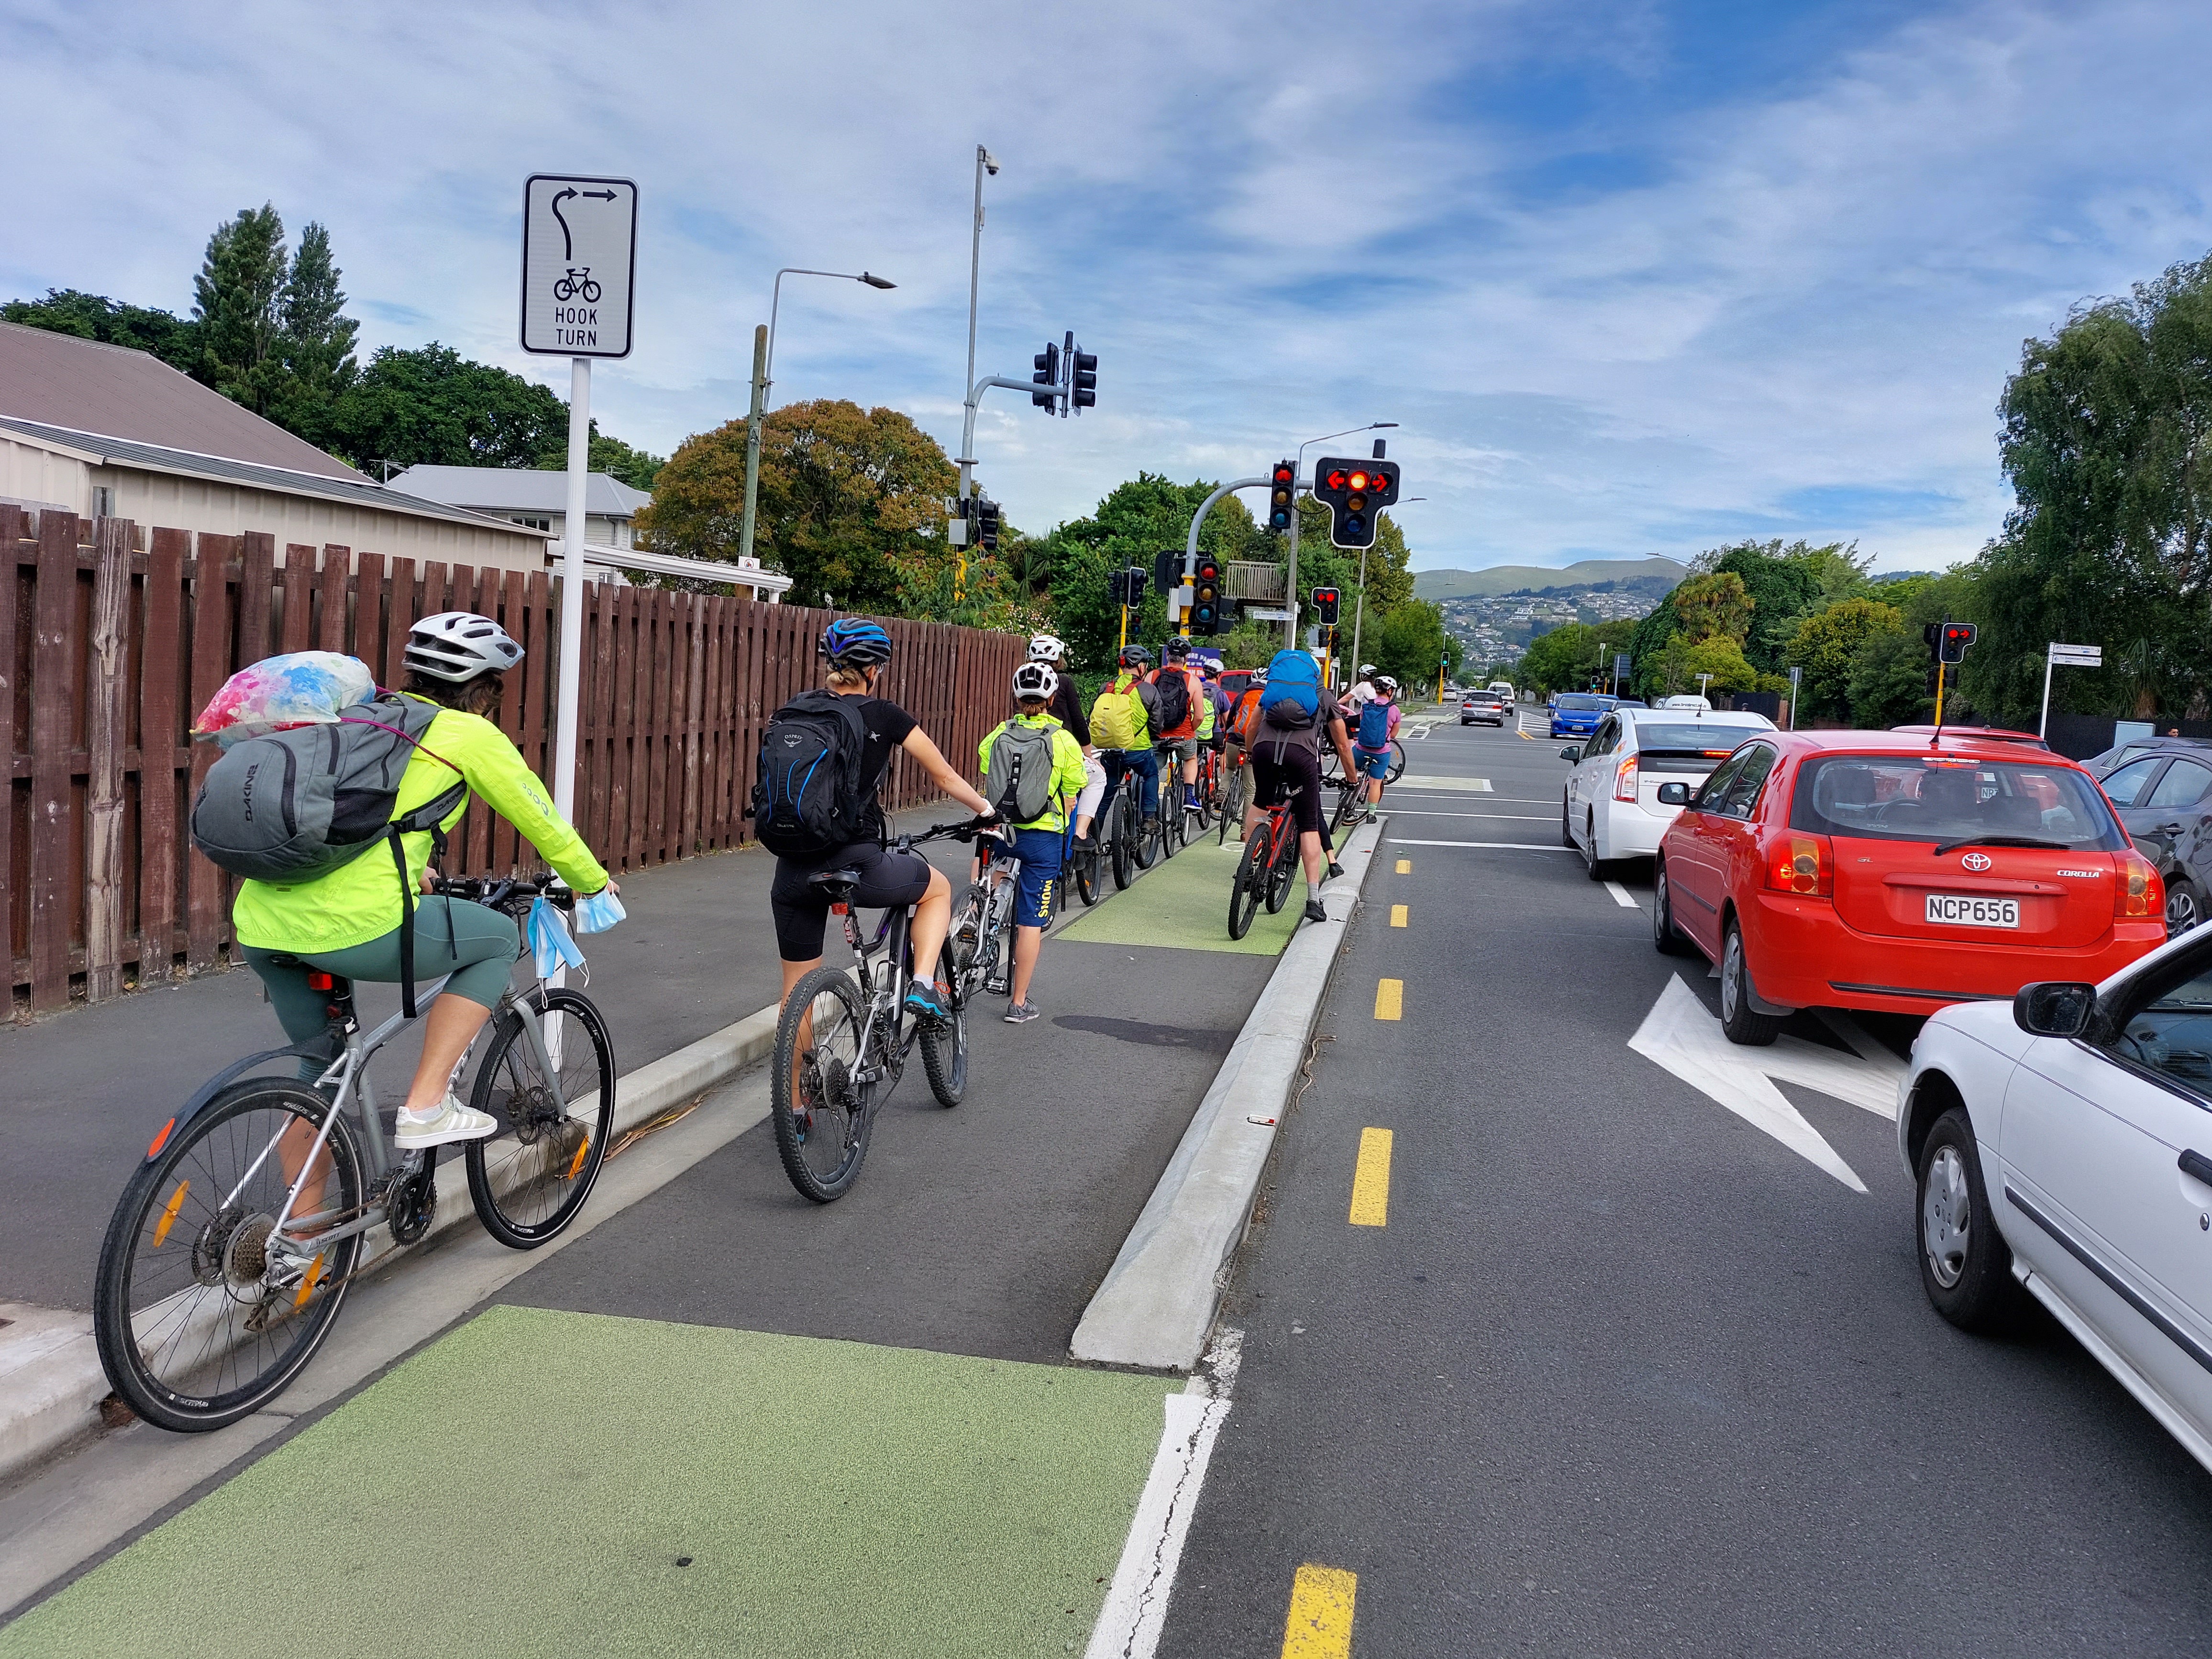
Cycling is our biggest strength down here, and I suspect we will see that increase into the twenties, like it is in a lot of European cities (and used to be here).
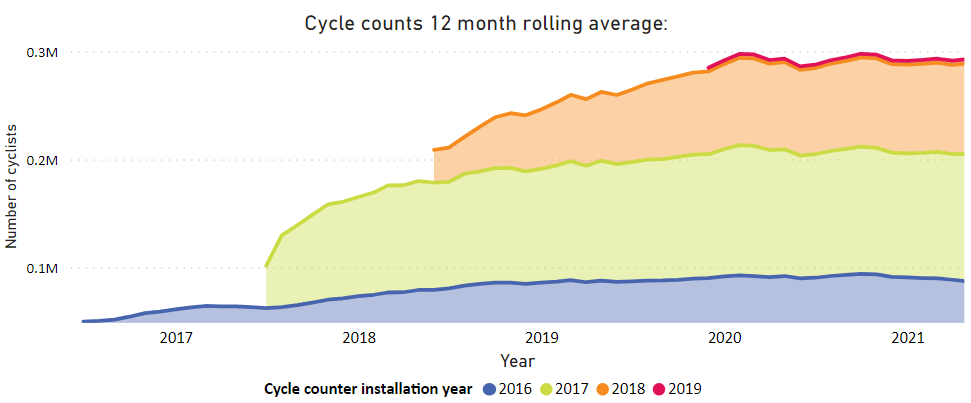
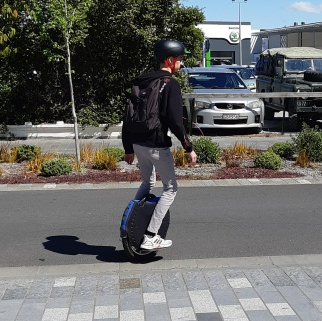
The explosion of new technology is helping with this: e-bikes, e-scooters, e-skateboards, and e-unicycles are becoming a regular sight on our cycleways.

There is scope for walking to become a strength too for similar reasons to cycling – the city is flat, compact and has the perfect climate for walking – hardly any rain, and lots of days that are sunny whilst not overly hot. The main thing we need for this is increased density: more stuff available within a reasonable walk of home.
I expect public transport mode share to rise but we’re starting from such a low base it’s hard to see it getting up to Wellington levels in just 8 years, particularly without an established rail network. I’m ever hopeful on that front, but even if we went out and built Rapid Transit tomorrow, it would still take a long time for adjacent land-use to reshape itself to the point where it’s having the same sort of impact that Wellington’s network has.
Here’s hoping we can make like the Black Caps and plummet from that number one spot to the bottom half of the table as quickly as possible!


Interesting to note:
Tom Tom Index Ranking 2020 (1=most congested) in mode share order as above
Christchurch is also the most congested, except for Palermo & Bari in Italy & Wellington – noting all rankings will be covd19 affected.
Christchurch 171
Canberra 319
Hamilton Canada 380
Quebec City 330
Buffalo 393
Turin 189
Winnipeg 284
Halifax 282
Palermo 60
Malaga 324
Murcia 300
Bari 140
Cordoba 370
Victoria na
Alicante 337
Florence 270
Vigo 355
Bologna 254
Birmingham Uk 210
Eindhoven 241
Las Palmas 314
Serville na
Valencia 271
Wellington 82
Also interesting to note that NZ cities rank quite badly
Auckland 63
Wellington 82
Hamilton 118
Christchurch 171
Tauranga 183
Dunedin 215
Mainly reflective of the low density land use and tightly defined travel demand – 40 hour week and school hours + high car ownership and use.
LikeLike
I’m a little surprised at this as I always thought Christchurch wasn’t particularly congested compared to most cities of comparable size.
LikeLike
That is an incredibly old photo of Wellington. Somewhere between 1983 and 1984, I’d say. Love it.
LikeLike
You caught me out, I just googled photos of Wellington and that one popped up, i don’t even know where it is from.
LikeLike
Eindhoven is now greater than 40% for bike, equal with car! Public transport still very low.
https://www.tandfonline.com/doi/pdf/10.1080/09654313.2020.1854691
LikeLike
After reading this article I thought – surely we are not #1 anymore as the data was collected in 2011-2014. I updated the wikipedia article for the 2018 census… and we are now 2nd! Huge improvement there /s. However it will be exciting to see the new modal share statistics once the 2023 census data has been released. Surely there will be a change with all the new cycling infrastructure that has been built in the past few years…
LikeLike
Oh wow moving down the rankings! Any comparison is tricky as different places measure things in different ways and at different years. But still useful as a rough guide. Yep looking forward to the next census. The last census used subtely different wording to the previous ones which muddied the water quite a bit with the mode share stats. Next one should be much more comparable.
LikeLike