Cyclist volumes in Christchurch have made like the Black Caps and been smashing records all over the show lately. I thought I’d take a closer look (data available here).
The Antigua Street bridge is the busiest counter in the city (possibly country?), regularly clocking over 2,000 cyclists a day. But in the 4 1/2 years it’s been installed it has never managed to break the 2,500 barrier. Last week it did just that.
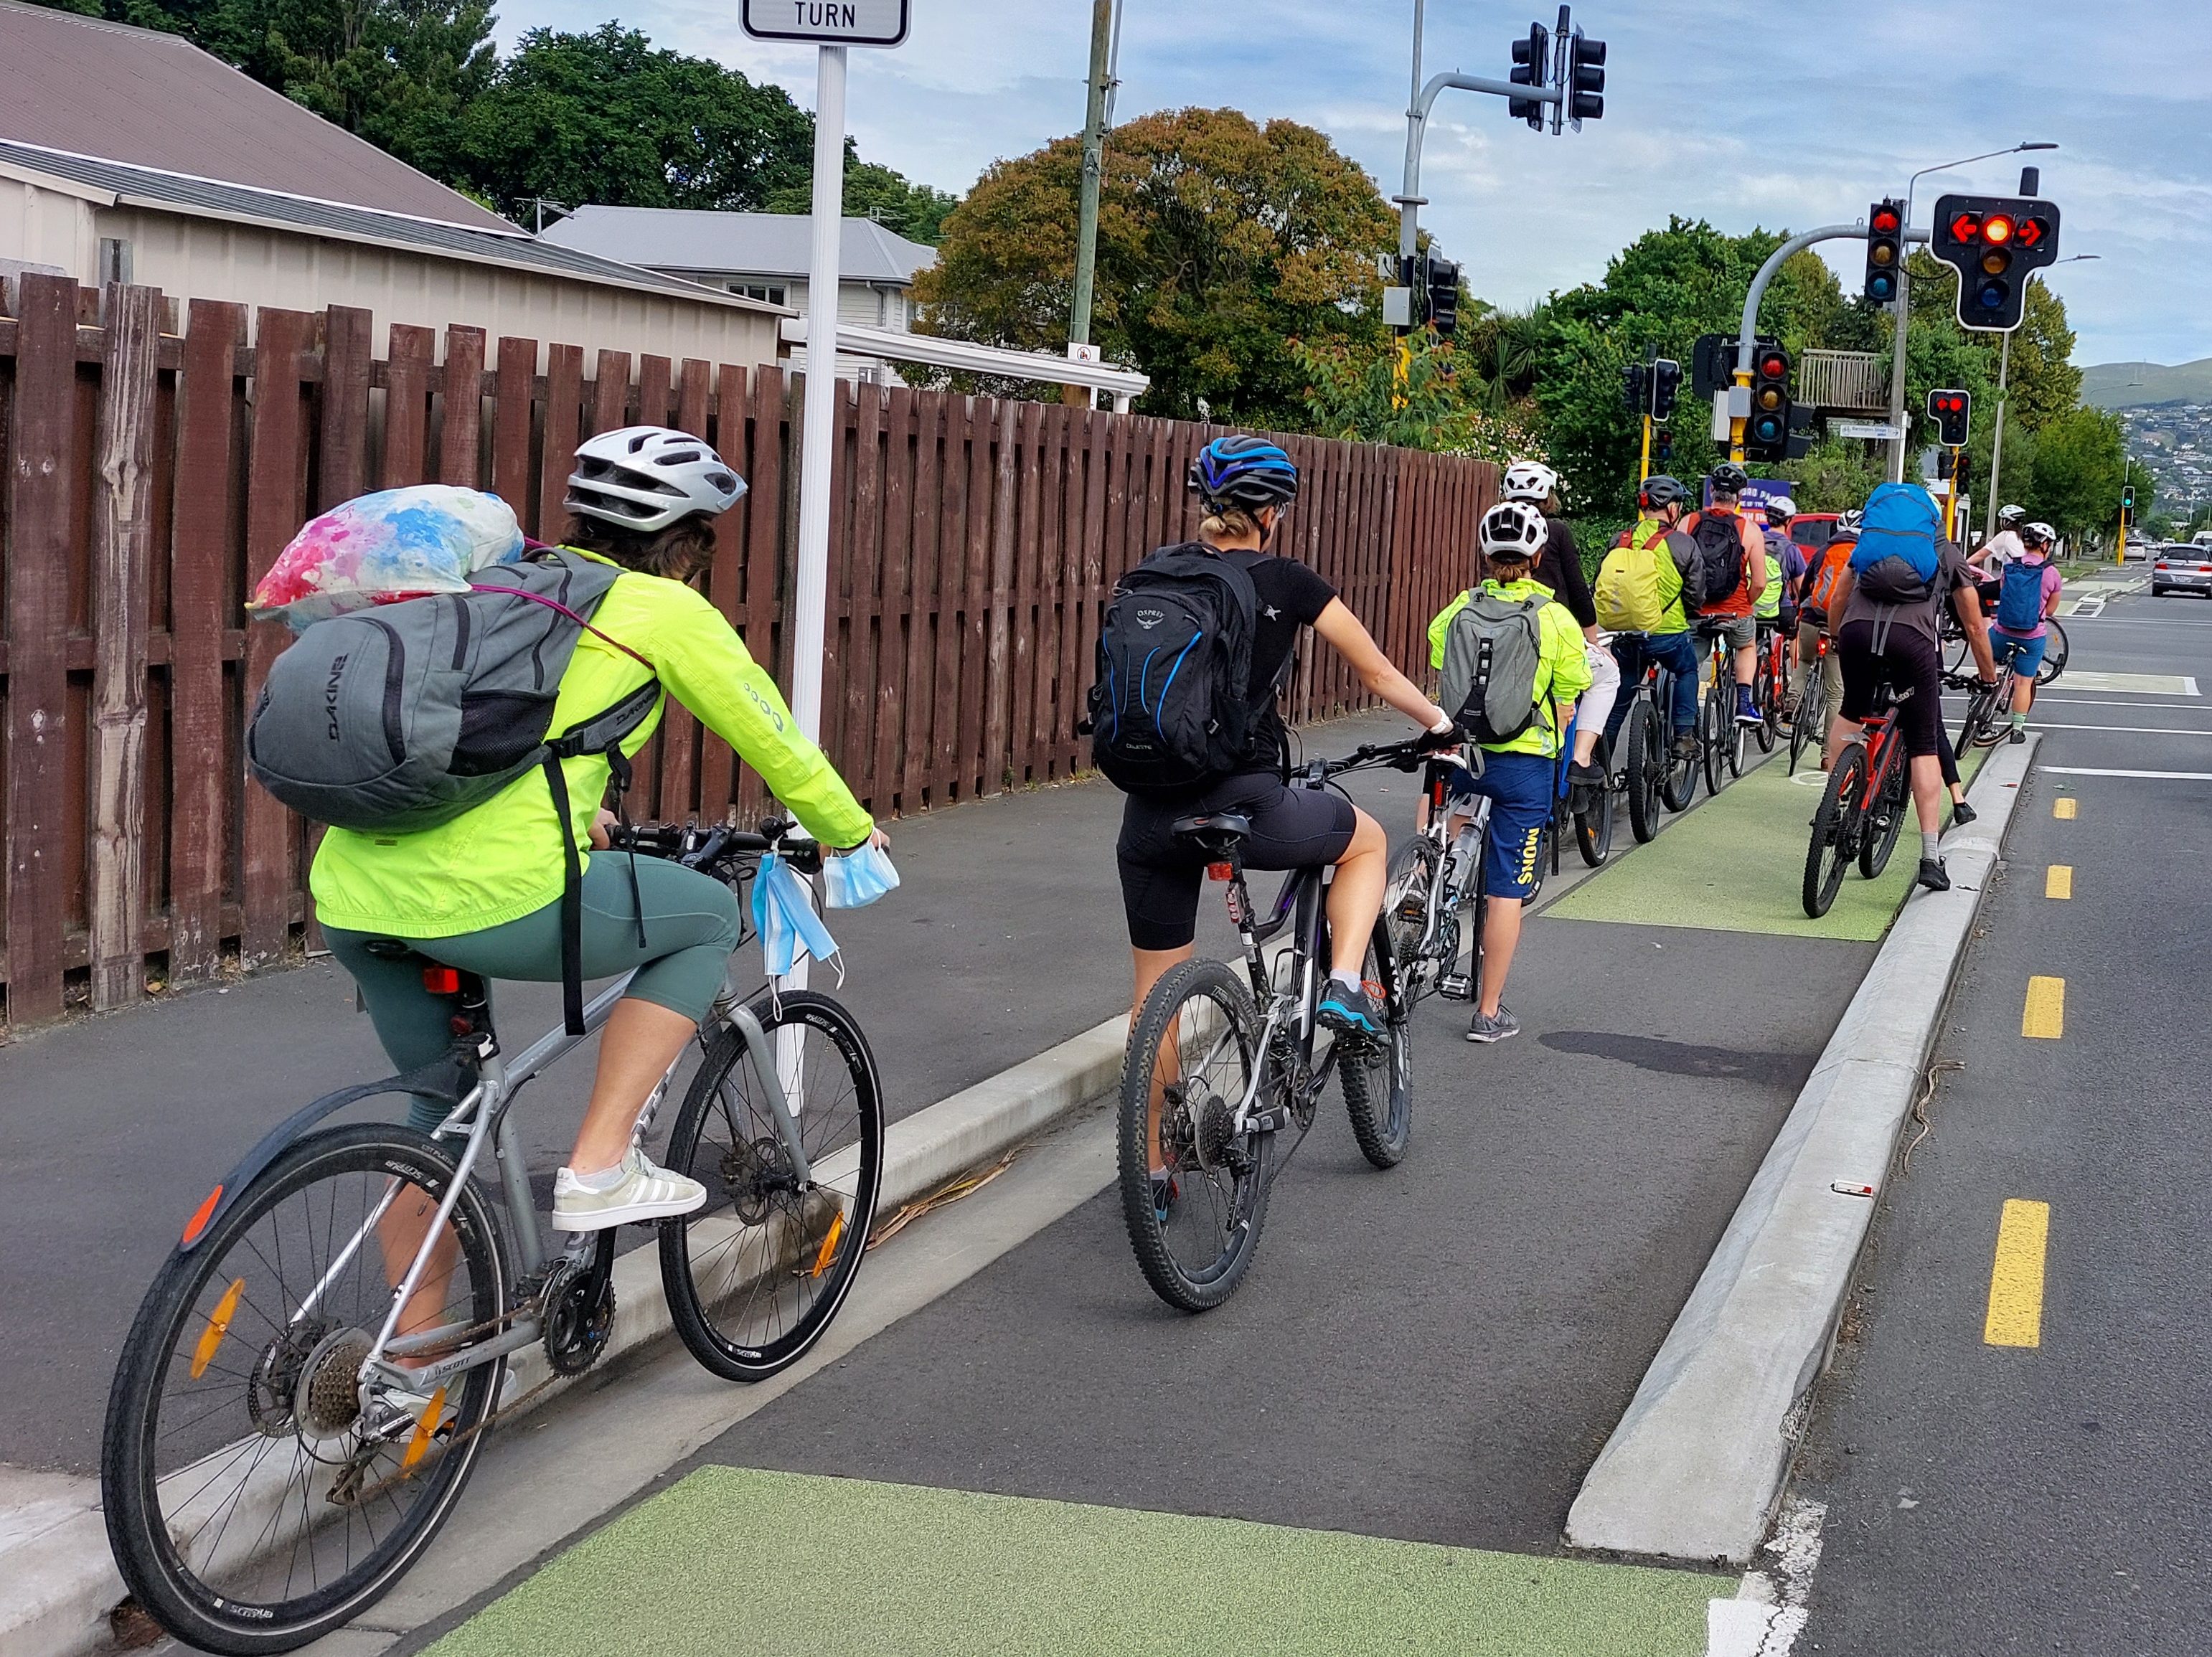
Monday 20th February dawned a bright crisp day, forecast of 24 degrees so pleasant without being sweltering, no rain. Most schools were restarted and just about everyone was back at work again. Many of them probably having made new years resolutions to get fitter, healthier and more productive. 2,516 people got out of bed and decided to bike across the bridge, setting a new high.

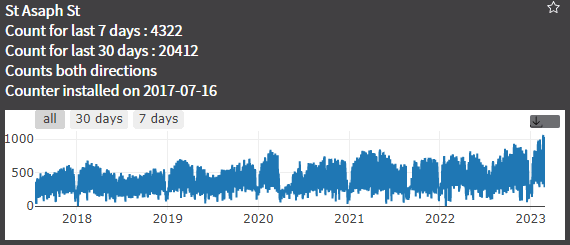
Other count sites to have also broken their record in the last two weeks include St Asaph Street, South Hagley Park, Worcester Street, Linwood Avenue, Charles Street, Buckleys Road, Colombo Street and Peverel Street.
I don’t find the online charts the easiest to read, so I made my own. The graph below shows the average number of cyclists recorded each day, for each year.
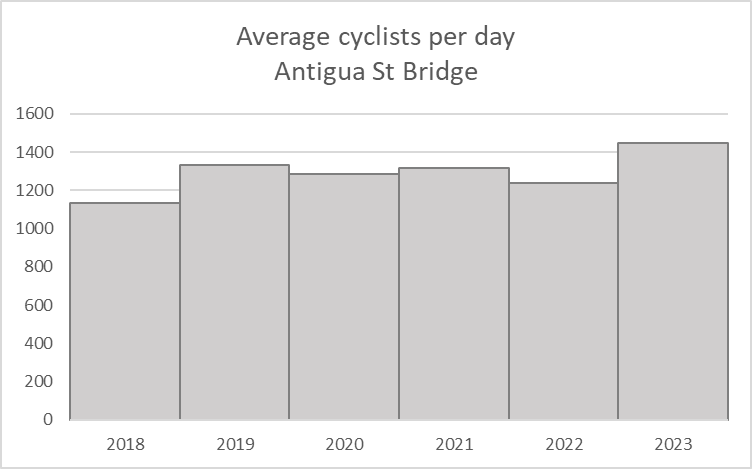
Prior to covid hitting, numbers seemed to be growing fast. They then flattened off through three years of lockdowns and traffic light systems, but it seems like this year they are finally starting to grow again.
I’d caveat this with saying that the number of cyclists in 2023 so far is obviously restricted to just January/February, which does tend to have higher numbers than the rest of the year. It would be expected to drop off by something like 10% as the year goes by.
I did the same exercise for the ten busiest sites in the city which are (in order):
- Antigua St bridge
- Hagley Park South
- Antigua Street (further south near Moorhouse Ave)
- Hagley Park North
- Railway Cycleway
- St Asaph Street
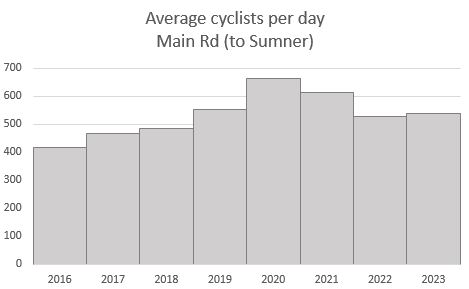
- Main Road (to Sumner)
- University Drive
- Lincoln Road
- Collins Street

Here they are:


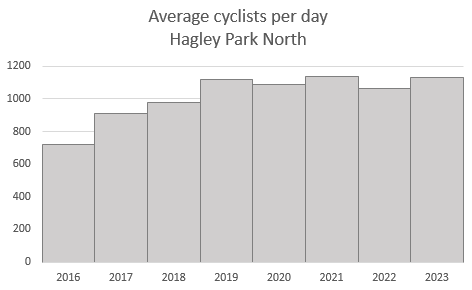


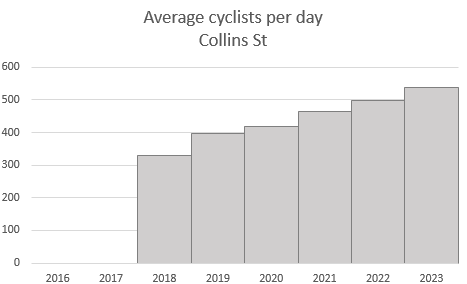
Generally they are all recording healthy growth. St Asaph St stands above the rest, almost doubling numbers in just five years – that’s pretty amazing considering all the controversy when it was put in. And Collins Street is exceptional too, presumably due to the Little River Link connecting into it.
In contrast, some are not doing so well. University Drive is all over the place, I’m guessing due to more online lectures. Sumner is odd- it seems like huge volumes of people must have biked to the beach during lockdowns, and the numbers are rebalancing again now. Lincoln Road is also slightly strange because they put in place a cyclist ban on it for much of last year, and I suspect some haven’t come back. Those three drag the average down somewhat.
But if you sum them together you still get this graph.

Across the ten counters, there was 14% growth per annum pre-covid, then virtually no growth for 3 years through lockdowns and traffic light systems. So far in 2023 we have reverted back to about 14% growth again.
Winter is coming and that’s when the real test will come, but 2023 couldn’t have started much better.
Am also pumped to see the census results when they come out – remember to fill in your forms!

Great stats. Sumner may be due to the roadworks that have been in different sections over the last couple of years as the Coastal Pathway has progressed.
LikeLike
I think showing a graph that compares the average of cyclists per day in 2023 with the average of cyclists per day in 2022 is misleading. As noted by you the daily average in 2023 will be skewed as numbers tend to be much higher in summer. Nonetheless, great to see many day counter records trashed!!! People are voting with their pedals it seems.
LikeLike
Agree somewhat, it’s just hard to find any better way to show the data. I could wait till the end of the year but am too impatient. 12 month rolling averages are often used but they don’t illustrate the recent growth. Just showing the raw data is the most transparent, but it’s too detailed and incomprehensible to the casual reader. I think I’ll do a follow up post digging into this a little more.
LikeLike
It’s just a very small thing. Almost felt embarrassed to raise it but I think it is important to keep the cycling stats real. I always enjoy your posts. They are always interesting and well researched. Really appreciate all the time and effort you put into this blog!
LikeLiked by 1 person
For all its flaws in not highlighting very recent changes, I still think a 12-mth rolling average is the most useful way to represent the level of cycling controlled for seasonal change. Effectively it is an “Annual Average Daily Traffic” (AADT) measure, just like we already do for counting motor traffic. It’s why I use it in my own analysis of Chch cycle counts, which was also suggesting an uptick in cycle numbers over the past six months to end of 2022, even before the most recent record counts… https://cyclingchristchurch.co.nz/2023/01/21/chch-cycle-counter-update-2022-lockdown-jitters/
LikeLike
I did create a rolling average graph but it didn’t really show anything, so would’ve been a boring post. I think in another few months it would be good to see it.
LikeLike
I think a good way to show it would be either
1: showing the data restricted to January and February for every year so there is a consistent measure
2: a prediction of the yearly average based off the first two months for 2023, using the average ratio of yearly trips to Jan/Feb trips from every previous year.
Having these graphs to supplement would show if we are expecting to still be growing or if we are on track for the same as last year
LikeLike
Yea i actually did the first one of these, have a look at my new post.
LikeLike