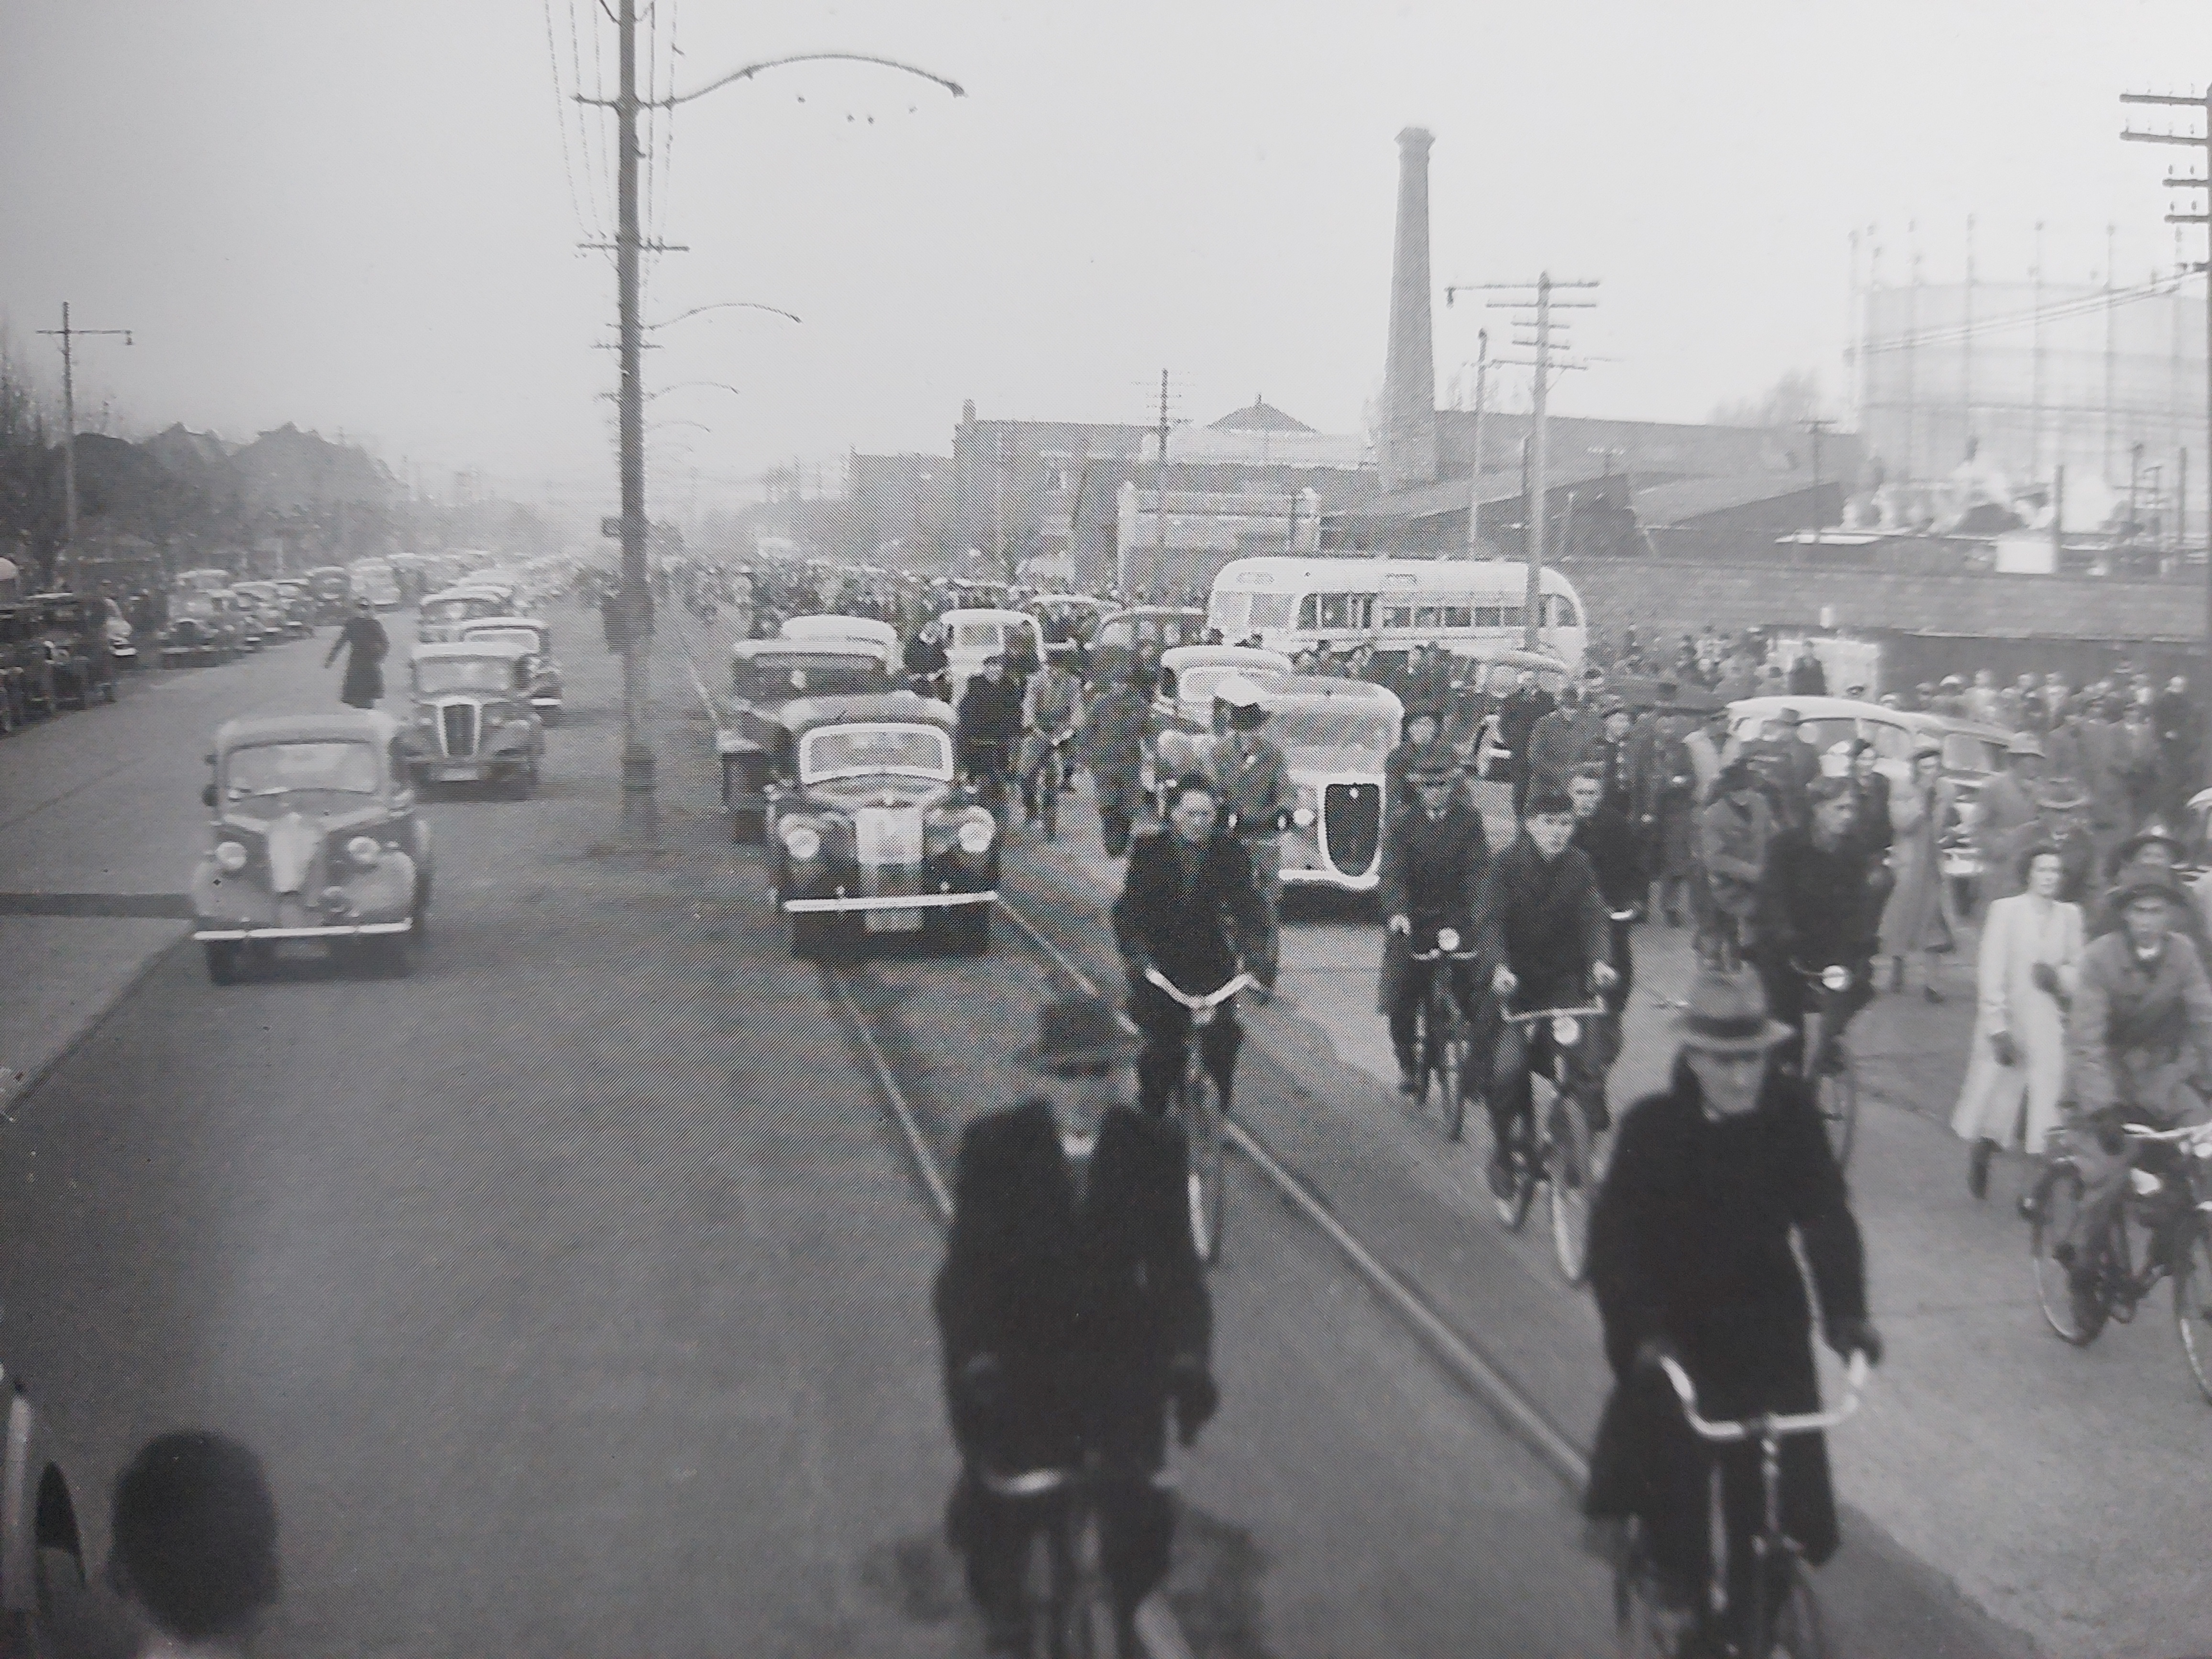
I posted a couple of weeks ago about how many of the cycle counters around Christchurch are going gang-busters and recording personal bests for their daily cycle volumes.
However that is a bit of a simplification. When you look at different periods the story can start to get cloudy. There were requests for a comparison of past years just looking at January and February. So here are some:
Firstly, the Antigua Street Boatshed Bridge:
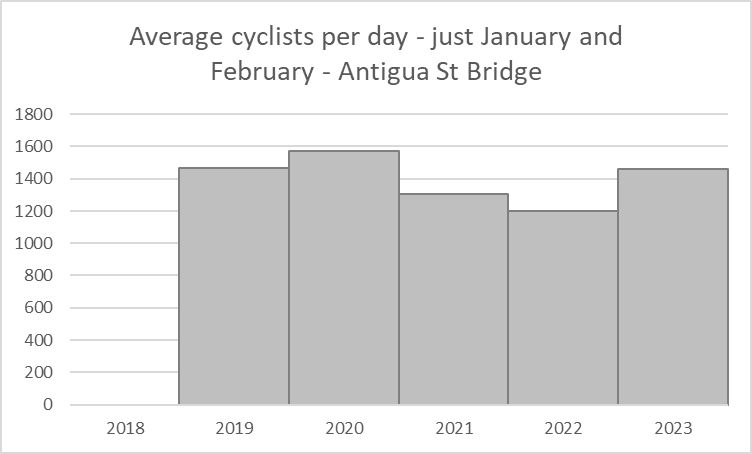
Despite breaking its daily record, over the 2-month period January to February, the 2020 numbers still set the bar. Unlike St Asaph Street, which is quite a bit higher in 2023:

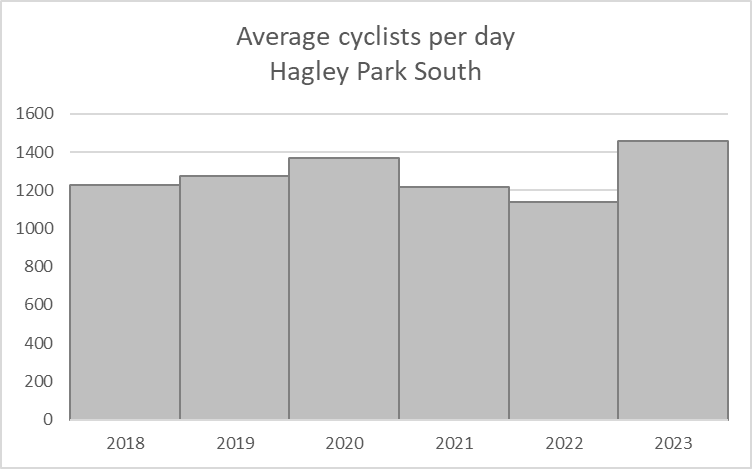
Likewise Hagley Park South:
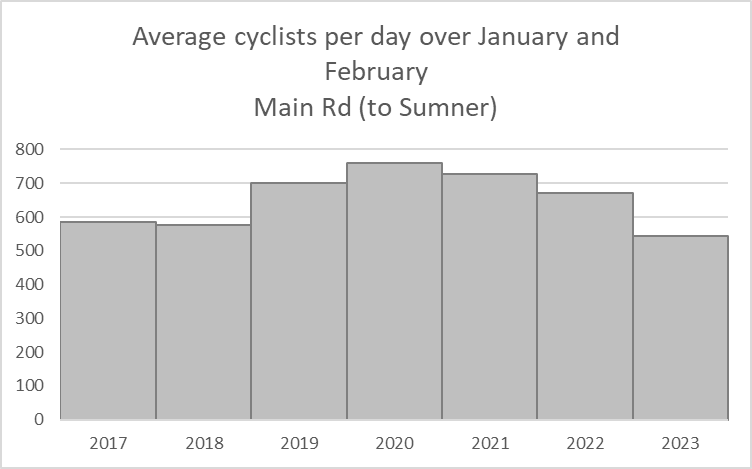
But then there are a few like Sumner which have gone the other way. I’ve been told that the construction of the cycleway to Sumner has basically blocked this route for a fair chunk of this year, which may be causing the drop.
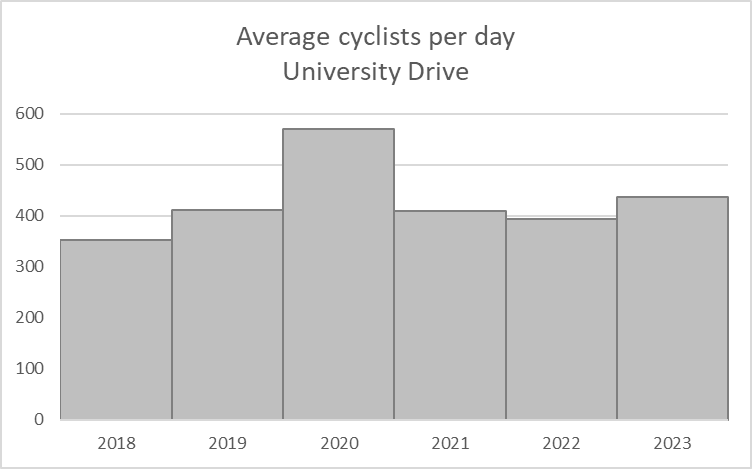
Also University Drive well down on pre-covid 2020, presumably due to online lectures:
When you sum the busiest ten sites together you get this. All up, the average daily numbers of cyclists in January and February 2023 was just shy of the average in January and February 2020.

I think it’s important to keep the covid story front of mind . All forms of travel are still lower than what they were pre-covid. For example, bus patronage is 86% of what is what pre-covid. I haven’t looked at the 2023 numbers but late 2022 traffic volumes were hovering around 95% of pre-covid numbers. So even for cycle numbers to be back to 97% of pre-covid levels (which is what the graph above works out as) means cycling is leading the charge.

One thought on “Cycle Counts part II”