
In my last blog, I asked: “how is Canterbury patronage doing?” The background to that question is that Auckland Transport regularly puts their patronage data onto their website, and Greater Wellington used to update their data monthly until mid-2018. With Environment Canterbury (ECan), you’ve got to dive into the reports that go to their Greater Christchurch Public Transport Joint Committee, but it doesn’t include the raw data that give the clearest picture of what’s going on.
I made a submission to ECan’s Long Term Plan (LTP) in April 2018 and one of my eight recommendations was for them to publish ridership data monthly. That way it’s transparent, and if there’s a gap between their vision and the current reality, this must to be visible to anyone who is interested. Glen Koorey put it the following way:

When my recommendation hadn’t been acted on by the end of last year, I followed up with ECan’s chair (Steve Lowndes) and asked for a progress report, and the latest set of data. After a bit of back-and-force, I’m happy to be able to report the following:
- Patronage data up until November 2018 has been made available to me and they are happy for me to publish it.
- Going forward, they will automatically send me monthly updates.
- ECan staff are currently working on a way of publishing the data through their own website.
That’s excellent news times three. Thank you!
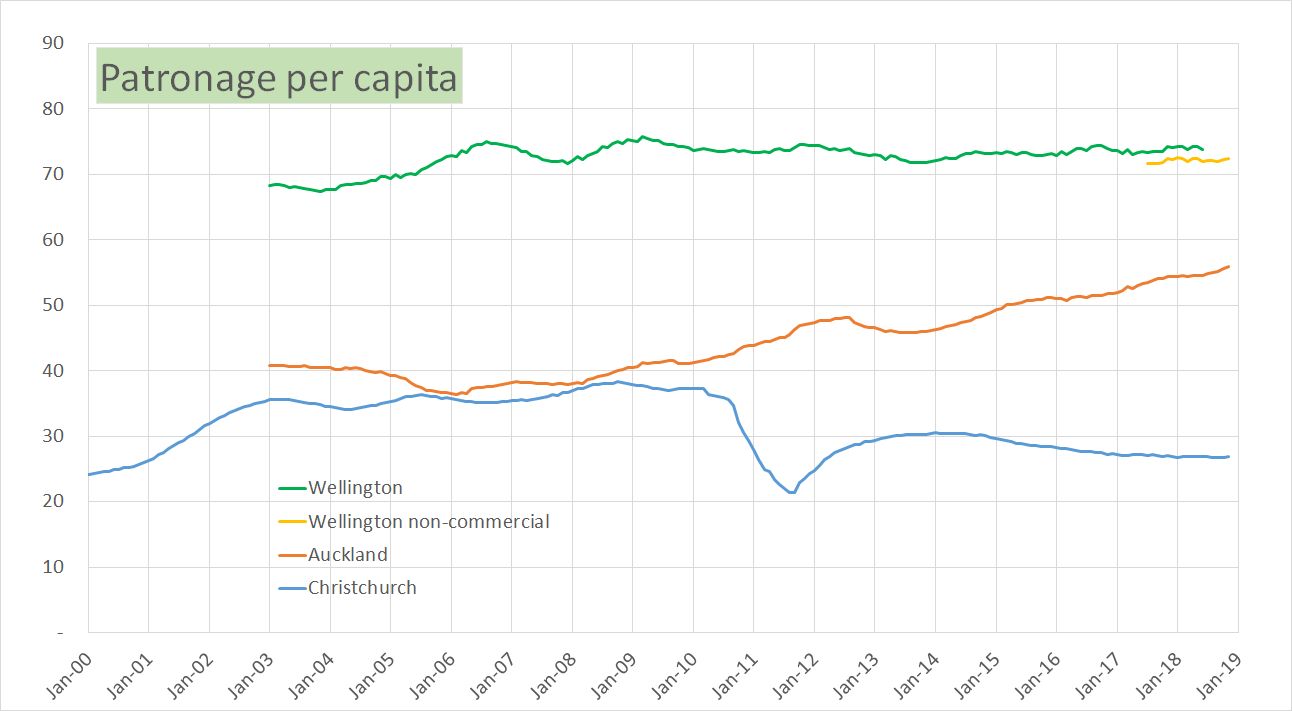
What do the data tell us? Well, the previous steady decline in patronage per capita appears to have been arrested. Comparing July to November 2017 with the same period a year later, the data are steady (that’s before I use 12-month data smoothing, as explained previously). So hopefully we see an ongoing trend reversal from decline to at least steady patronage.

So now that recommendation #4 has been dealt with (to my satisfaction), let’s move onto the related recommendation #2. I’ve already explained in a previous post why it’s important to report on “patronage per capita” rather than just “patronage”. Basically, when you’ve got population growth, that growth may result in an apparent increase in patronage. What counts, though, is how many trips on public transport the average person makes year after year. That’s the number we ought to be interested in.
So why does ECan report on patronage only? After a bit of digging, I reckon the culprit is the Transport Agency’s Procurement Manual. In section 11.7, it specifies the Key Performance Indicators (KPIs) and under the attribute ‘Patronage’, regional councils must report on “number of passenger boardings per service trip operated” and “average trip length” (see the screen shot below). I think we shall have a quiet word with our transport ministers as it’s in that manual that “patronage per capita” ought to be added.
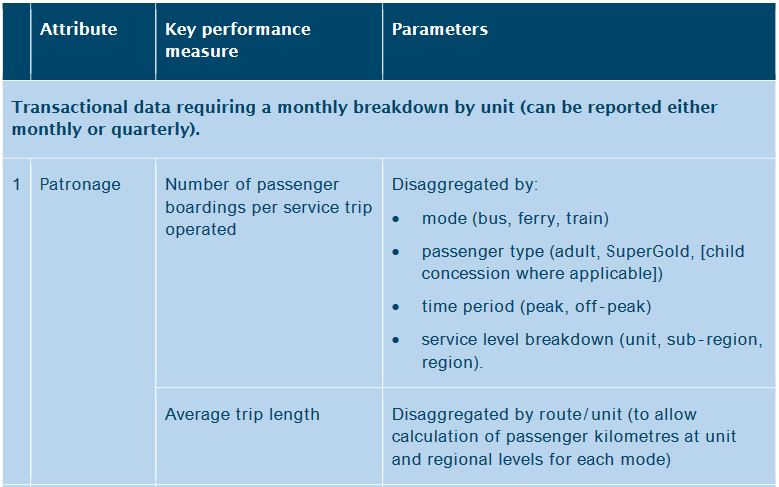
How about we slot the following in above “Average trip length”?
- Key performance measure: Number of passenger boardings per service trip operated
- Adjusted for changes in population and computed as an annual value “patronage per capita”.
That said, there’s of course nothing stopping ECan to start reporting the more meaningful ‘patronage per capita’ right now. I’d like to see that happen as per my recommendation #2. Because the August 2018 messaging that talked about a “rise just under one percent” in patronage was fake news. Patronage per capita was 27.21 in 2016/17. In 2017/18, we were down to 26.81 boardings per capita. That’s a reduction by nearly 1.5%. Dressing that up as an increase really irks me.
How about it, ECan? Can you amend your reporting?

love your work..
LikeLike