A few weeks ago I looked at the latest cycling numbers. In short, they are booming. This post is a quick update regarding public transport numbers.
In short, they are also booming.
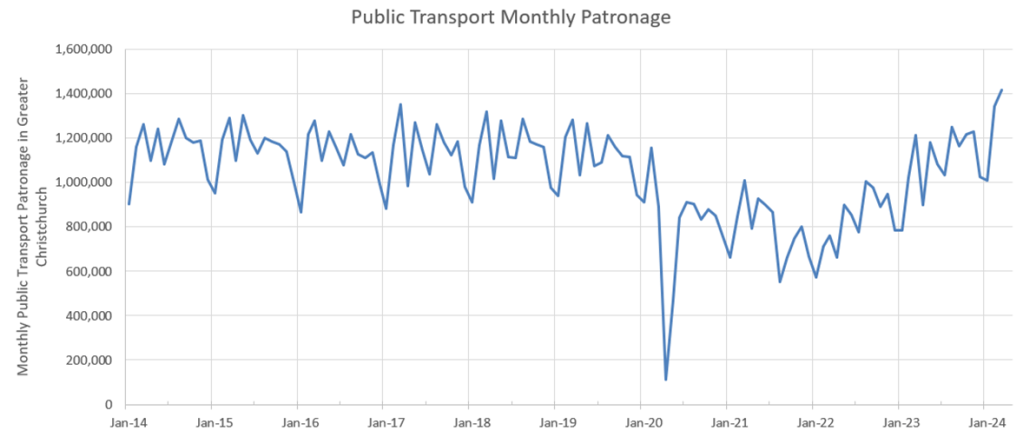
The graph below shows the public transport patronage in Greater Christchurch each month over the last decade. Last month had the highest patronage in over a decade.
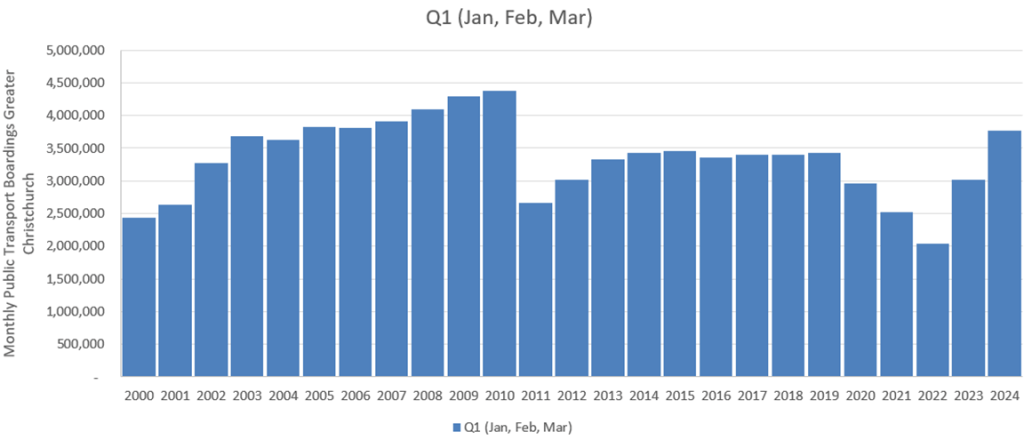
I’ve also looked at the whole first quarter of 2024 and compared it to the first quarter of every year since 2000, so going back a littler further. This shows that patronage is higher than it’s been at any time since the earthquakes. It’s still lower than what we were seeing pre-earthquake, but not by a lot, being broadly similar to where we were in 2006. If the current growth trend continues we’ll be exceeding pre-quake levels as early as next year. Growth may slow down though now we’re out of the covid bounce back but even so, I’d be surprised if patronage didn’t overtake pre-quake levels at some point in the next few years.
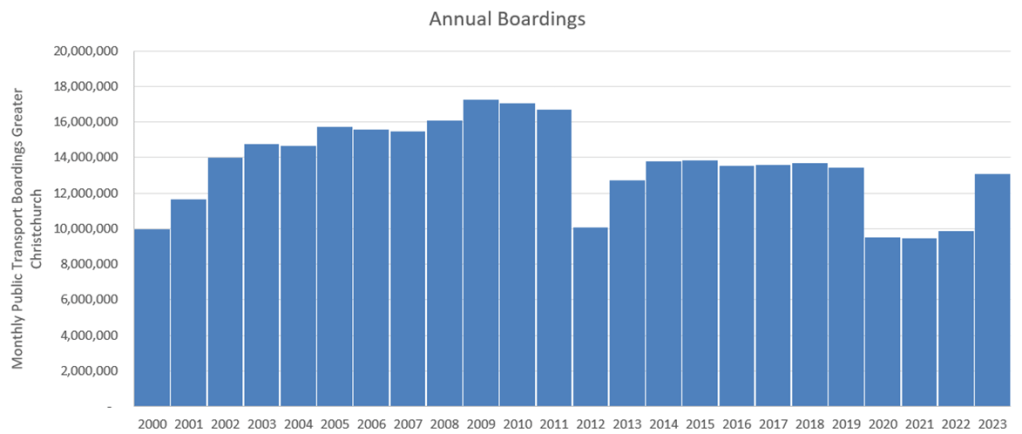
The graph below shows the annual boardings. Overall 2023 had a similar level of total patronage to the 6-7 years between the earthquakes and covid. As shown above though, this masks the fact that 2023 had a sluggish start which gradually grew throughout the year, meaning the annual numbers don’t look a high as the monthly ones.
This high and rapidly growing public transport use is great news for the city, the country and the planet. I think it partly reflects on the good work of a whole pile of people in various public offices, but probably it mostly just reflects broader economic and social conditions. The change in government may impact on this as they cut public transport budgets to fund their motorways, but there are larger forces at work and I suspect we’ll continue to see public transport use grow despite the political headwinds we’re about to sail into.

How does this look per capita, like in this post: https://talkingtransport.com/2018/12/09/lies-damned-lies-and-patronage-statistics/?
LikeLike
Good point. I didn’t do that analysis but might do at some point. Wouldn’t look quite so good.
LikeLike